During a recent project, my team had some problems configuring 3scale with Jaeger. After spending some time doing some research, I’ve prepared a guide for configuring and understanding some configuration properties and how Jaeger architecture works.
export GTW_PROJECT_NAMESPACE=3scale29
export JAEGER_AGENT_SVC=jaeger-agent.microservices.svc.cluster.local:6831
cat jaeger_config.json

{
    "service_name": "apicast-production",
    "disabled": false,
    "sampler": {
      "type": "const",
      "param": 1
    },
    "reporter": {
      "queueSize": 2000,
      "bufferFlushInterval": 5,
      "logSpans": true,
      "localAgentHostPort": "${JAEGER_AGENT_SVC}"
    },
    "headers": {
      "jaegerDebugHeader": "debug-id",
      "jaegerBaggageHeader": "baggage",
      "TraceContextHeaderName": "uber-trace-id",
      "traceBaggageHeaderPrefix": "testctx-"
    },
    "baggage_restrictions": {
        "denyBaggageOnInitializationFailure": false,
        "hostPort": "127.0.0.1:5778",
        "refreshInterval": 60
    }
}

oc delete configmap jaeger-config -n ${GTW_PROJECT_NAMESPACE}
oc create configmap jaeger-config --from-file=jaeger_config.json -n ${GTW_PROJECT_NAMESPACE}

oc set volume dc/${GTW_APICAST} --add --overwrite --name=jaeger-config-volume -m /tmp/jaeger/ -t configmap --configmap-name jaeger-config -n ${GTW_PROJECT_NAMESPACE}

oc set env dc/${GTW_APICAST} OPENTRACING_TRACER=jaeger -n ${GTW_PROJECT_NAMESPACE}
oc set env dc/${GTW_APICAST} OPENTRACING_CONFIG=/tmp/jaeger/jaeger_config.json -n ${GTW_PROJECT_NAMESPACE}
reporter.queueSize
Defines the max size of the in-memory buffer used to keep spans before they are sent out. When the queue is full, the older batches are overridden causing spans to be discarded
reporter.bufferFlushInterval
Defines how frequently the report flushes span batches.
sampler.type
Defines the type of sampler to use, e.g. probabilistic, or const
For applications with low to medium traffic, setting the sampling type to const and value to 1 will cause all spans to be reported. Similarly, tracing can be disabled by setting the value to 0, while context propagation will continue to work.
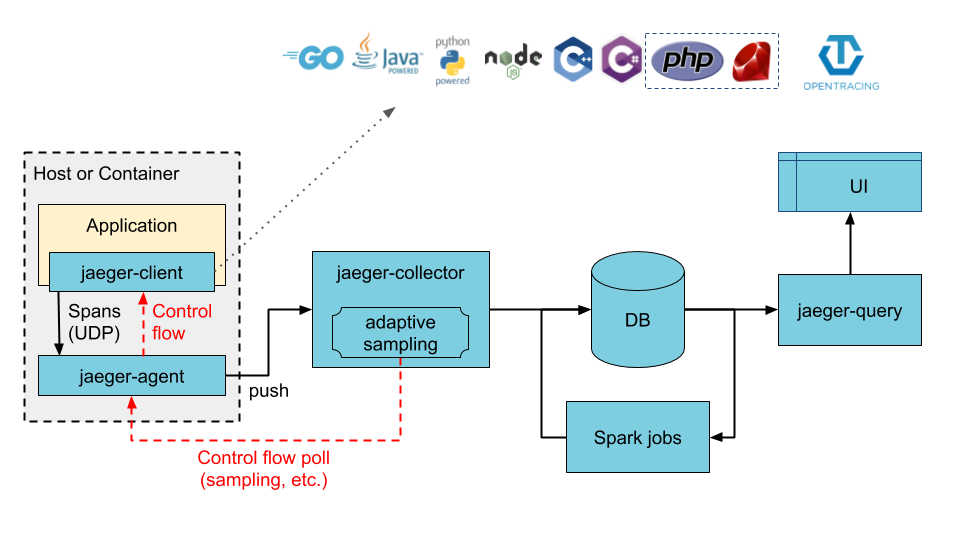
Jaeger Architecture
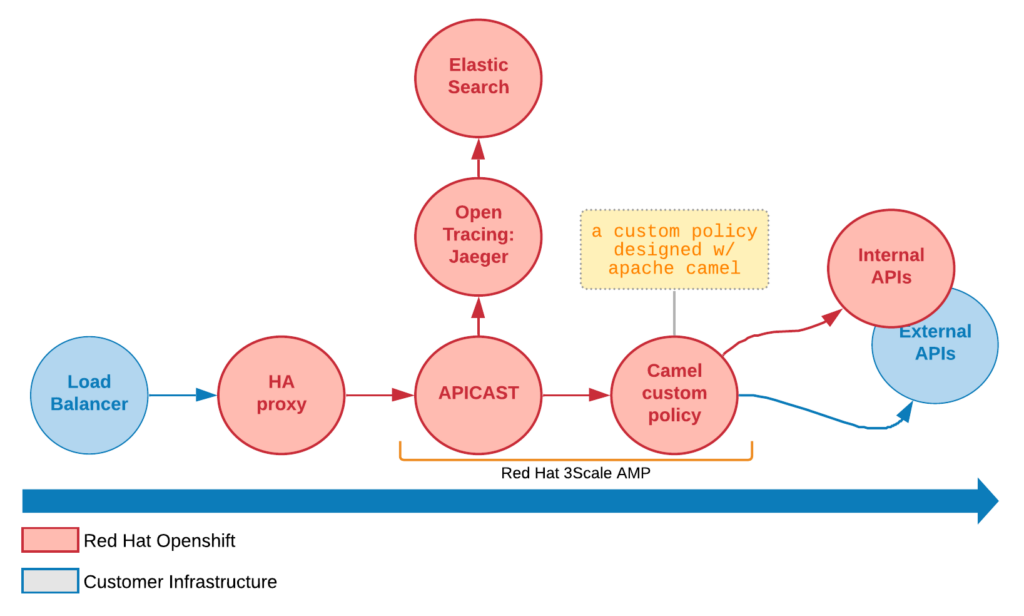
How tracing works
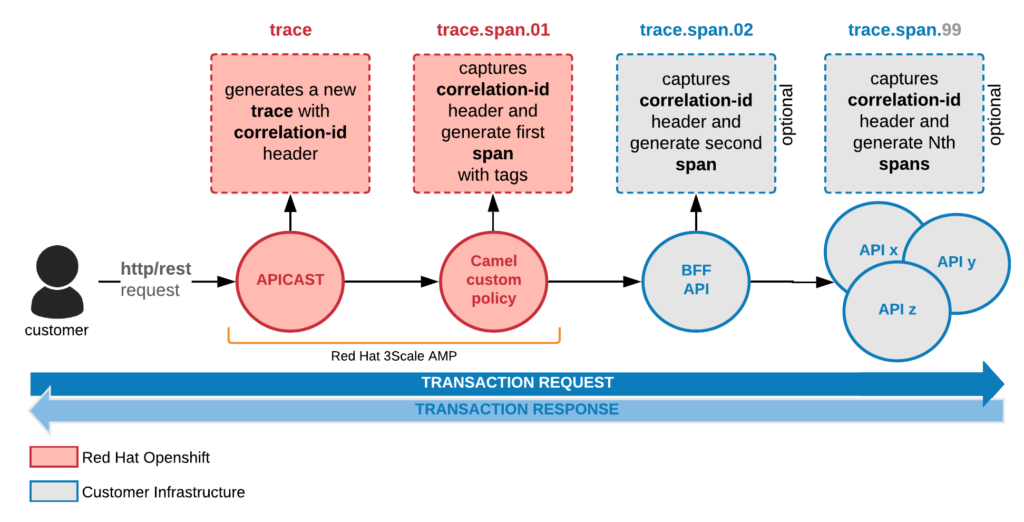
Tracing a chain of APIs or 3Scale Policies
Both APICAST gateway and any camel-policy installed and configured for 3scale are Jaeger clients. As we don’t have any additional rules in the gateway itself, we expect that both work the same in the total number of requests (external users sending http requests to 3scale). Both must have the same quantity of queues and flush-intervals values to not deal with any issue or back-pressure.
We don’t need to configure Jaeger for staging gateway. We will configure only for the production gateway.
The most critical components are Jaeger-agent and the Jaeger-collector. They both need careful attention to the allocation of computing resources (requests and limits). They will need to be continuously reviewed as soon we have some bottlenecks for collecting and/or flushing Jaeger spans into ElasticSearch database.
The Jaeger-agent is responsible for routing and discovery of Jaeger-collector, serving as an interface to the client applications (apicast-production, and any other camel-proxy used in the chain of observability).
Performance calculation demo
If we have something like 300 TPS as a requirement, we ended up with 18K transactions per minute. With that in mind, we must set reporter.queueSize with a minimum of 2000 with 5 seconds flush intervals, avoiding bottleneck and drop of spans. In that way, we can achieve something like 400 TPS at most, for dealing correctly with our initial requirement.
Architecture sizing and performance
jaeger-collector: Must target at least 3 container replicas.
jaeger-agent: Critical for network usage. Can’t have any latency and must strive for the best network performance. Don’t forget to review computing resources (requests and limits).
jaeger-query: Its the monolith application that delivers the GUI for user search. It’s where you can see all traces with their spans visually. It’s the least critical component for the Jaeger architecture.
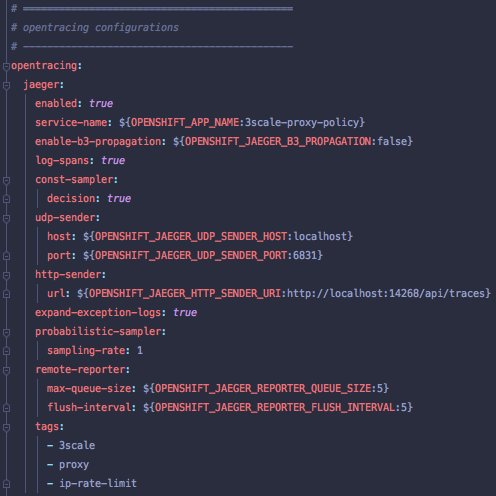
Regarding UDP and HTTP senders in APIs (springboot jaeger API)
When the instrumented application is generating a large number of spans and the agent/collector is close to the application, the networking overhead might be low, justifying a higher number of flush operations. When the HttpSenderis being used and the collector is not close enough to the application, the networking overhead might be too high so that a higher value for this property makes sense.
The UDP sender calls the Jaeger-agent. The HTTP sender calls directly the Jaeger-collector. I don’t know if the agent does some pre-processing of spans sanitization process, but certainly it works as a queue handling large amounts of requests. The UDP sender becomes a better option for production scenarios.
External References:
https://medium.com/jaegertracing/where-did-all-my-spans-go-a-guide-to-diagnosing-dropped-spans-in-jaeger-10d9697f8182
https://www.jaegertracing.io/docs/1.21/performance-tuning/
https://www.jaegertracing.io/docs/1.21/client-features/
https://itnext.io/adding-opentracing-support-to-apicast-api-gateway-a8e0a38347d2
https://github.com/opentracing-contrib/java-spring-jaeger/blob/master/README.md
https://medium.com/jaegertracing/tuning-jaegers-performance-7a60864cf3b1
![]()