In this lab we’ll make use of 3Scale 2.12 as our API Manager solution, and how it integrates easily with the monitoring stack provided by OpenShift from Red Hat. We will focus on 3Scale passive and active monitoring with the help of Alert Manager from Prometheus.
This demo should also work without changes with 3Scale 2.11.
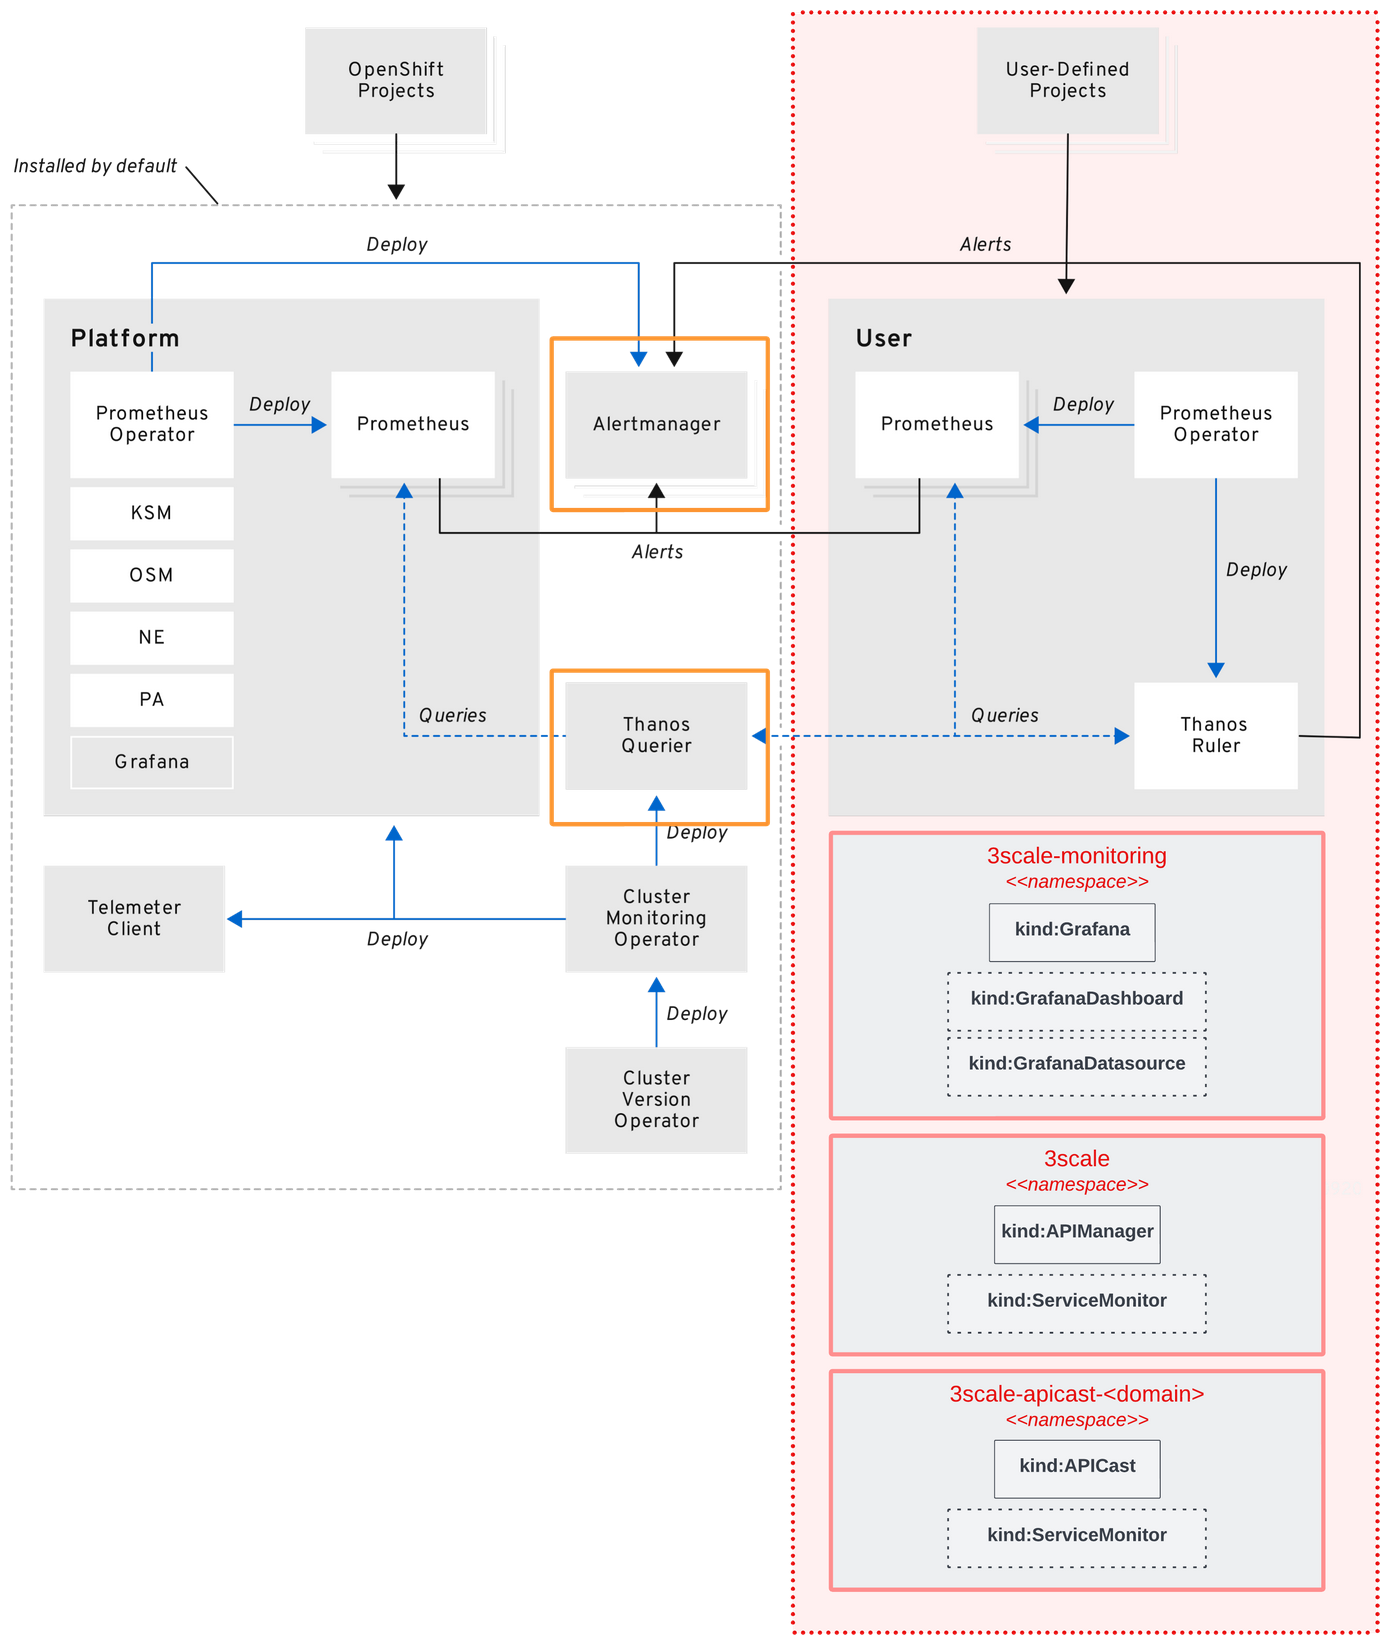
OpenShift container platform monitoring overview
Prerequisites
For this exercise, we’ll need:
- a valid Red Hat 3Scale subscription and registry.redhat.io pull secret
cluster-adminrole with an OpenShift 4.10 environment- 3Scale 2.11 or later already installed
- 3Scale APICast deployed into additional namespaces (optional)
- a good cup of coffee or latte!
Export variables
Set all environment variables that we’ll be using during this lab.
export OPENSHIFT_CONSOLE_PATH=console-openshift-console
export WILDCARD_DOMAIN=$(oc get route console -n openshift-console | awk '{ getline; print $2; }' | sed 's/'$OPENSHIFT_CONSOLE_PATH'\.//g'); echo $WILDCARD_DOMAIN
export MONITORING_NS=openshift-monitoring
export USER_WORKLOAD_MONITORING_NS=openshift-user-workload-monitoring
export MANAGER_MONITORING_NS=3scale-monitoring
export MANAGER_NS=3scale
export MANAGER_NAME=$(oc get APIManager -n $MANAGER_NS | awk 'NR>1{print $1}')
export APICAST_NSS=("3scale-apicast-intranet" "3scale-apicast-internet" "3scale-apicast-mobile")
Notice that we will be using three different namespaces to deploy adittional APICast instances that can serve as dedicated proxies to meet different application needs. You can edit these namespaces if you want.
OpenShift login
Access your OpenShift environment at the terminal. Example:
export USERNAME=john ; oc login --username=$USERNAME --server=https://api.cluster-xyz.xyz.domain.com:6443Monitoring namespace provisioning
Create all namespaces that we’ll be using:
oc new-project $MANAGER_MONITORING_NS --description="3scale monitoring stack" --display-name=$MANAGER_MONITORING_NS
oc label namespace $MANAGER_MONITORING_NS node.k8s.redhat/service=3scale-monitoring
oc label namespace $MANAGER_MONITORING_NS node.k8s.redhat/site=north
oc label namespace $MANAGER_MONITORING_NS monitoring-key=middleware
In this lab, I chose to apply some labels into $MANAGER_MONITORING_NS:
node.k8s.redhat/service and node.k8s.redhat/site.
For monitoring purposes, I’ll be using monitoring-key key and middleware as value to aid some monitoring requirements that we’ll use later in this exercise.
Enable user workload monitoring
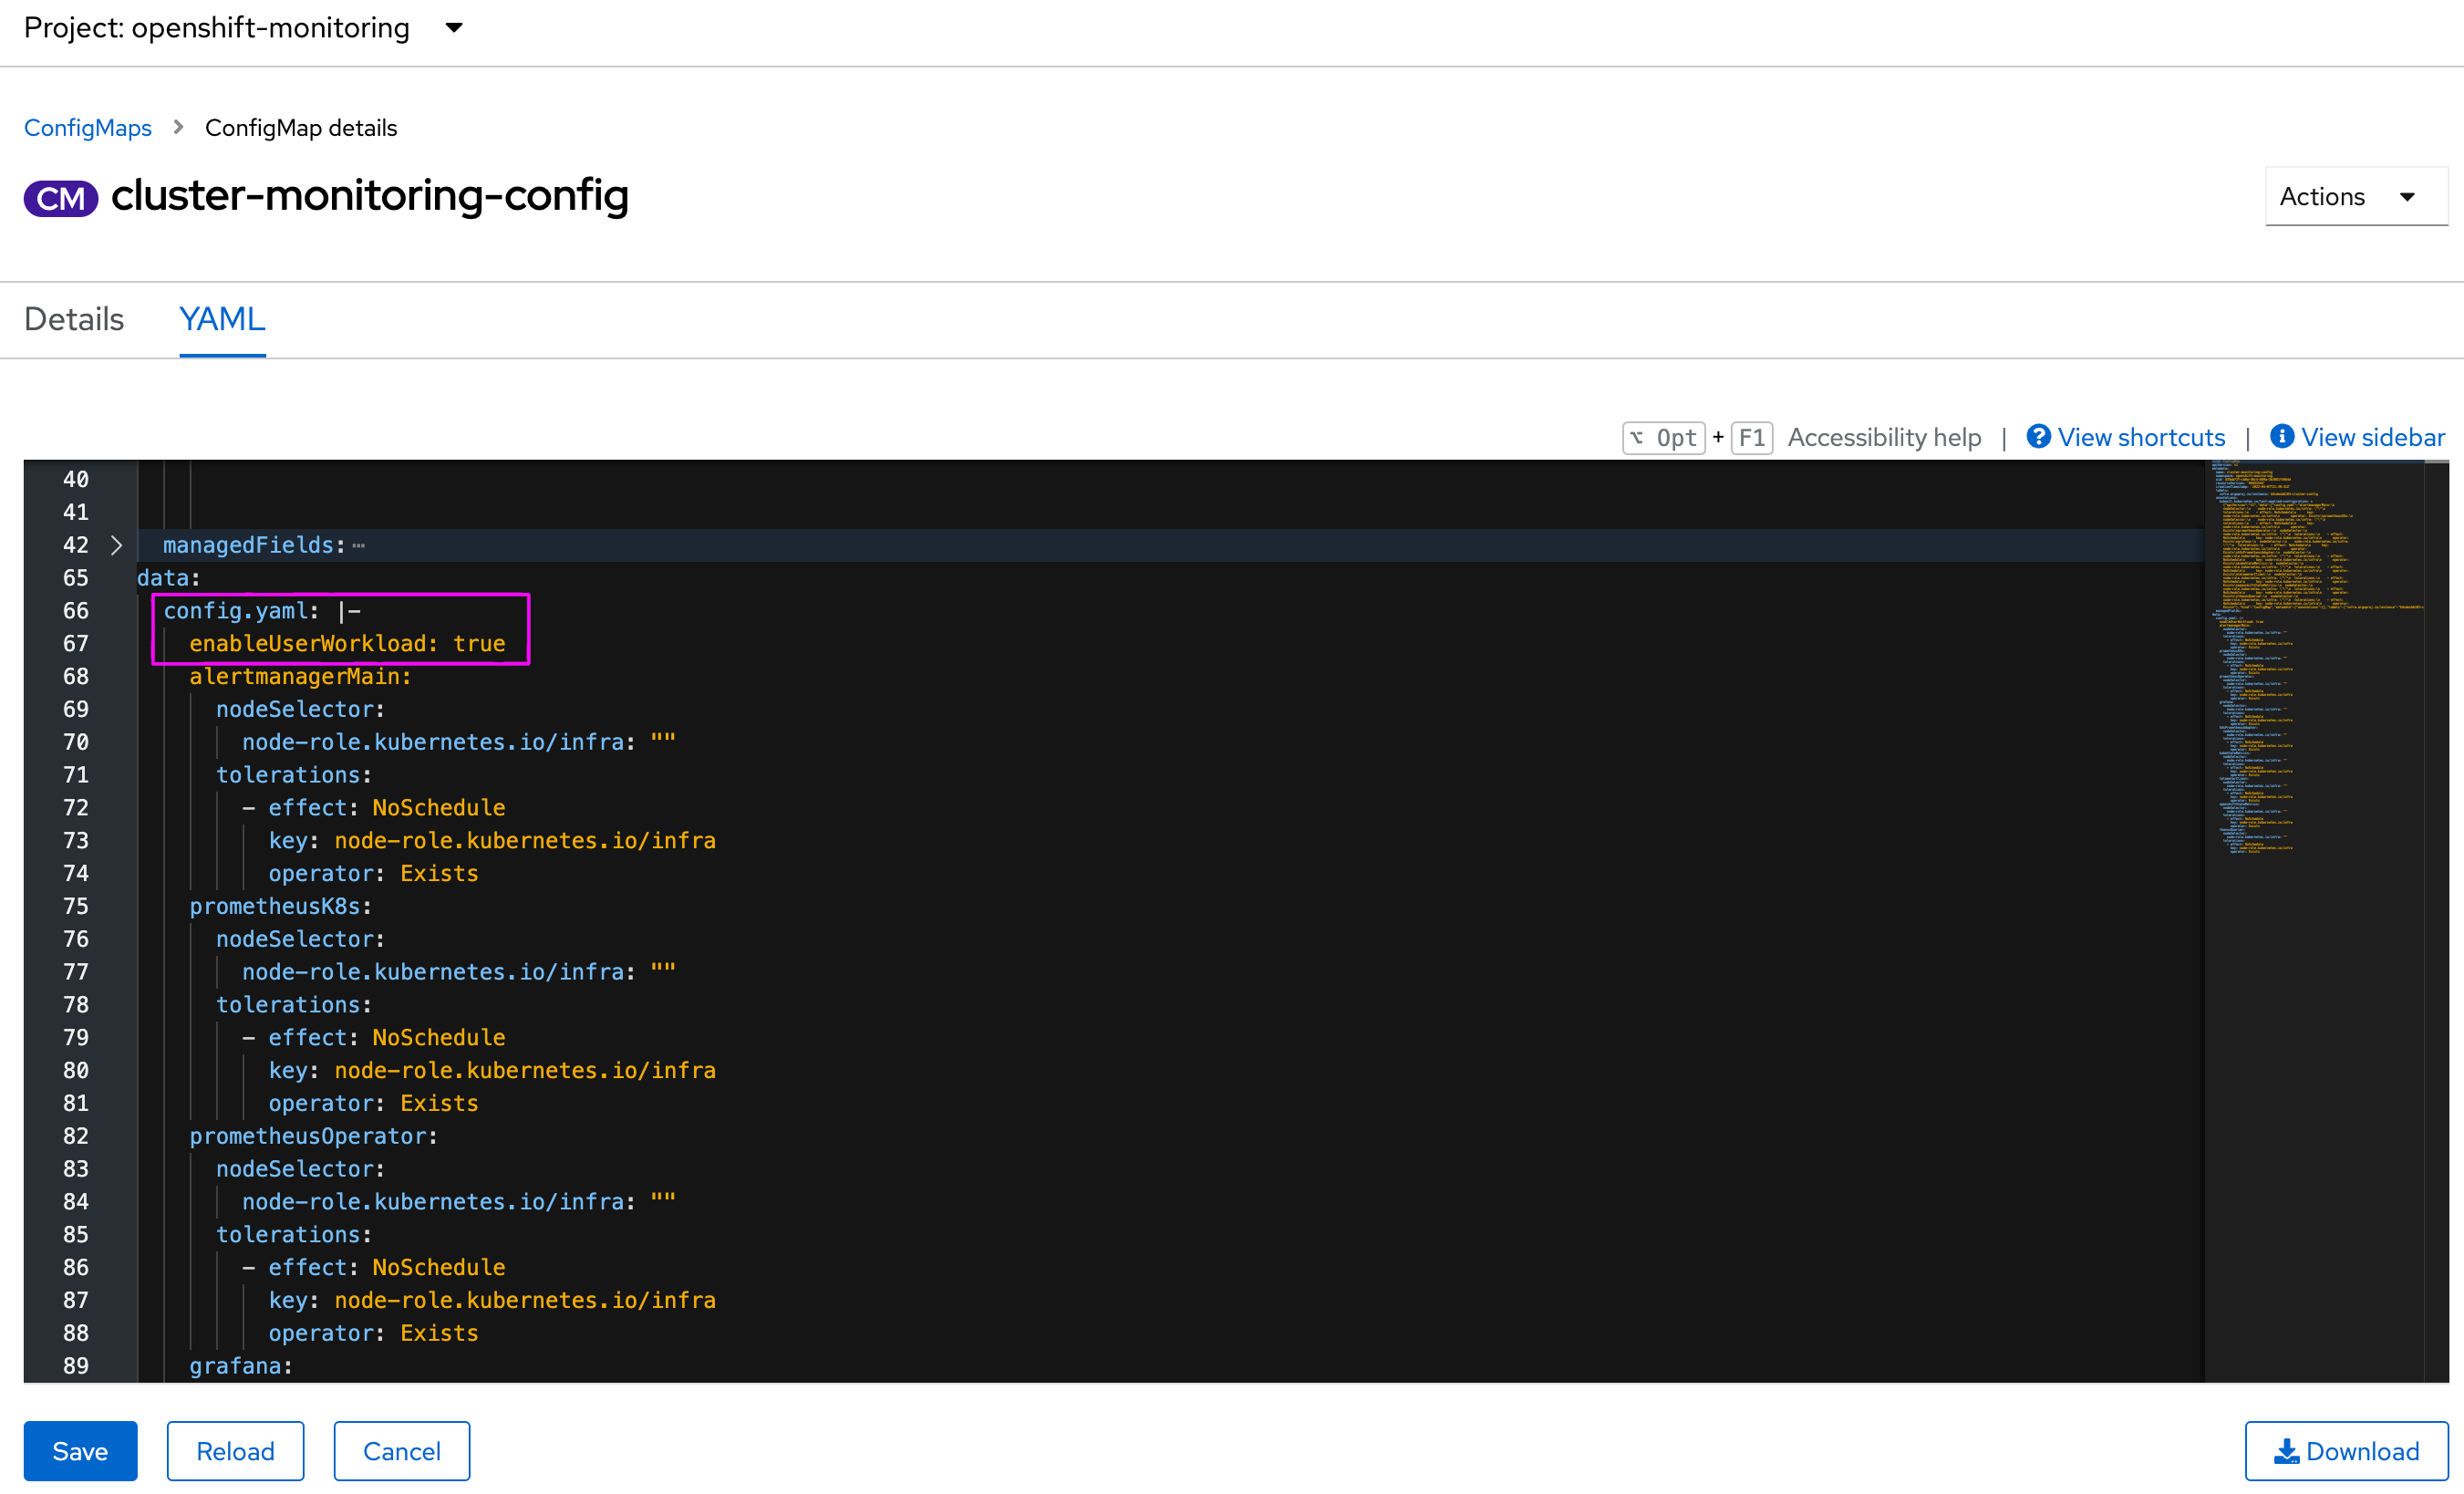
To enable 3Scale Prometheus alert rules, we need to create a cluster-monitoring-config configmap inside openshift-monitoring namespace. You can get more information and detailed configuration at OpenShift documentation.
First, let’s configure the cluster-monitoring-config config-map to enable OpenShift to monitor all user workload. This can be achieved with the following code:
echo '\nhttps://'console.apps.$WILDCARD_DOMAIN/k8s/ns/openshift-images/configmaps/cluster-monitoring-config'\n'If you don’t see this config-map you’ll need to create a new one.
cat > openshift-cluster-monitoring-configmap.yaml <<EOL
apiVersion: v1
kind: ConfigMap
metadata:
  name: cluster-monitoring-config
  namespace: openshift-monitoring
data:
  config.yaml: |
    enableUserWorkload: true
    prometheusOperator:
      nodeSelector:
        node-role.kubernetes.io/infra: ""
      tolerations:
        - effect: NoSchedule
          key: node-role.kubernetes.io/infra
          operator: Exists
    prometheusK8s:
      nodeSelector:
        node-role.kubernetes.io/infra: ""
      tolerations:
        - effect: NoSchedule
          key: node-role.kubernetes.io/infra
          operator: Exists
    alertmanagerMain:
      nodeSelector:
        node-role.kubernetes.io/infra: ""
      tolerations:
        - effect: NoSchedule
          key: node-role.kubernetes.io/infra
          operator: Exists
    kubeStateMetrics:
      nodeSelector:
        node-role.kubernetes.io/infra: ""
      tolerations:
        - effect: NoSchedule
          key: node-role.kubernetes.io/infra
          operator: Exists
    openshiftStateMetrics:
      nodeSelector:
        node-role.kubernetes.io/infra: ""
      tolerations:
        - effect: NoSchedule
          key: node-role.kubernetes.io/infra
          operator: Exists
    grafana:
      nodeSelector:
        node-role.kubernetes.io/infra: ""
      tolerations:
        - effect: NoSchedule
          key: node-role.kubernetes.io/infra
          operator: Exists
    telemeterClient:
      nodeSelector:
        node-role.kubernetes.io/infra: ""
      tolerations:
        - effect: NoSchedule
          key: node-role.kubernetes.io/infra
          operator: Exists
    k8sPrometheusAdapter:
      nodeSelector:
        node-role.kubernetes.io/infra: ""
      tolerations:
        - effect: NoSchedule
          key: node-role.kubernetes.io/infra
          operator: Exists
    thanosQuerier:
      nodeSelector:
        node-role.kubernetes.io/infra: ""
      tolerations:
        - effect: NoSchedule
          key: node-role.kubernetes.io/infra
          operator: Exists
EOL
oc apply -f openshift-cluster-monitoring-configmap.yaml
Or, you can just update it adding the key:
enableUserWorkload=truenote: When you save your changes to the cluster-monitoring-config ConfigMap object, some pods in the openshift-monitoring project might be redeployed. It can sometimes take a while for these components to redeploy.
note: If you have any issues with PODs trying to schedule into OpenShift nodes, you might want to disable all tolerations entries from the cluster-monitoring-config config-map. You might also schedule all PODs into worker and not infra nodes.
Ensure that all PODs are running before continuing with this lab.
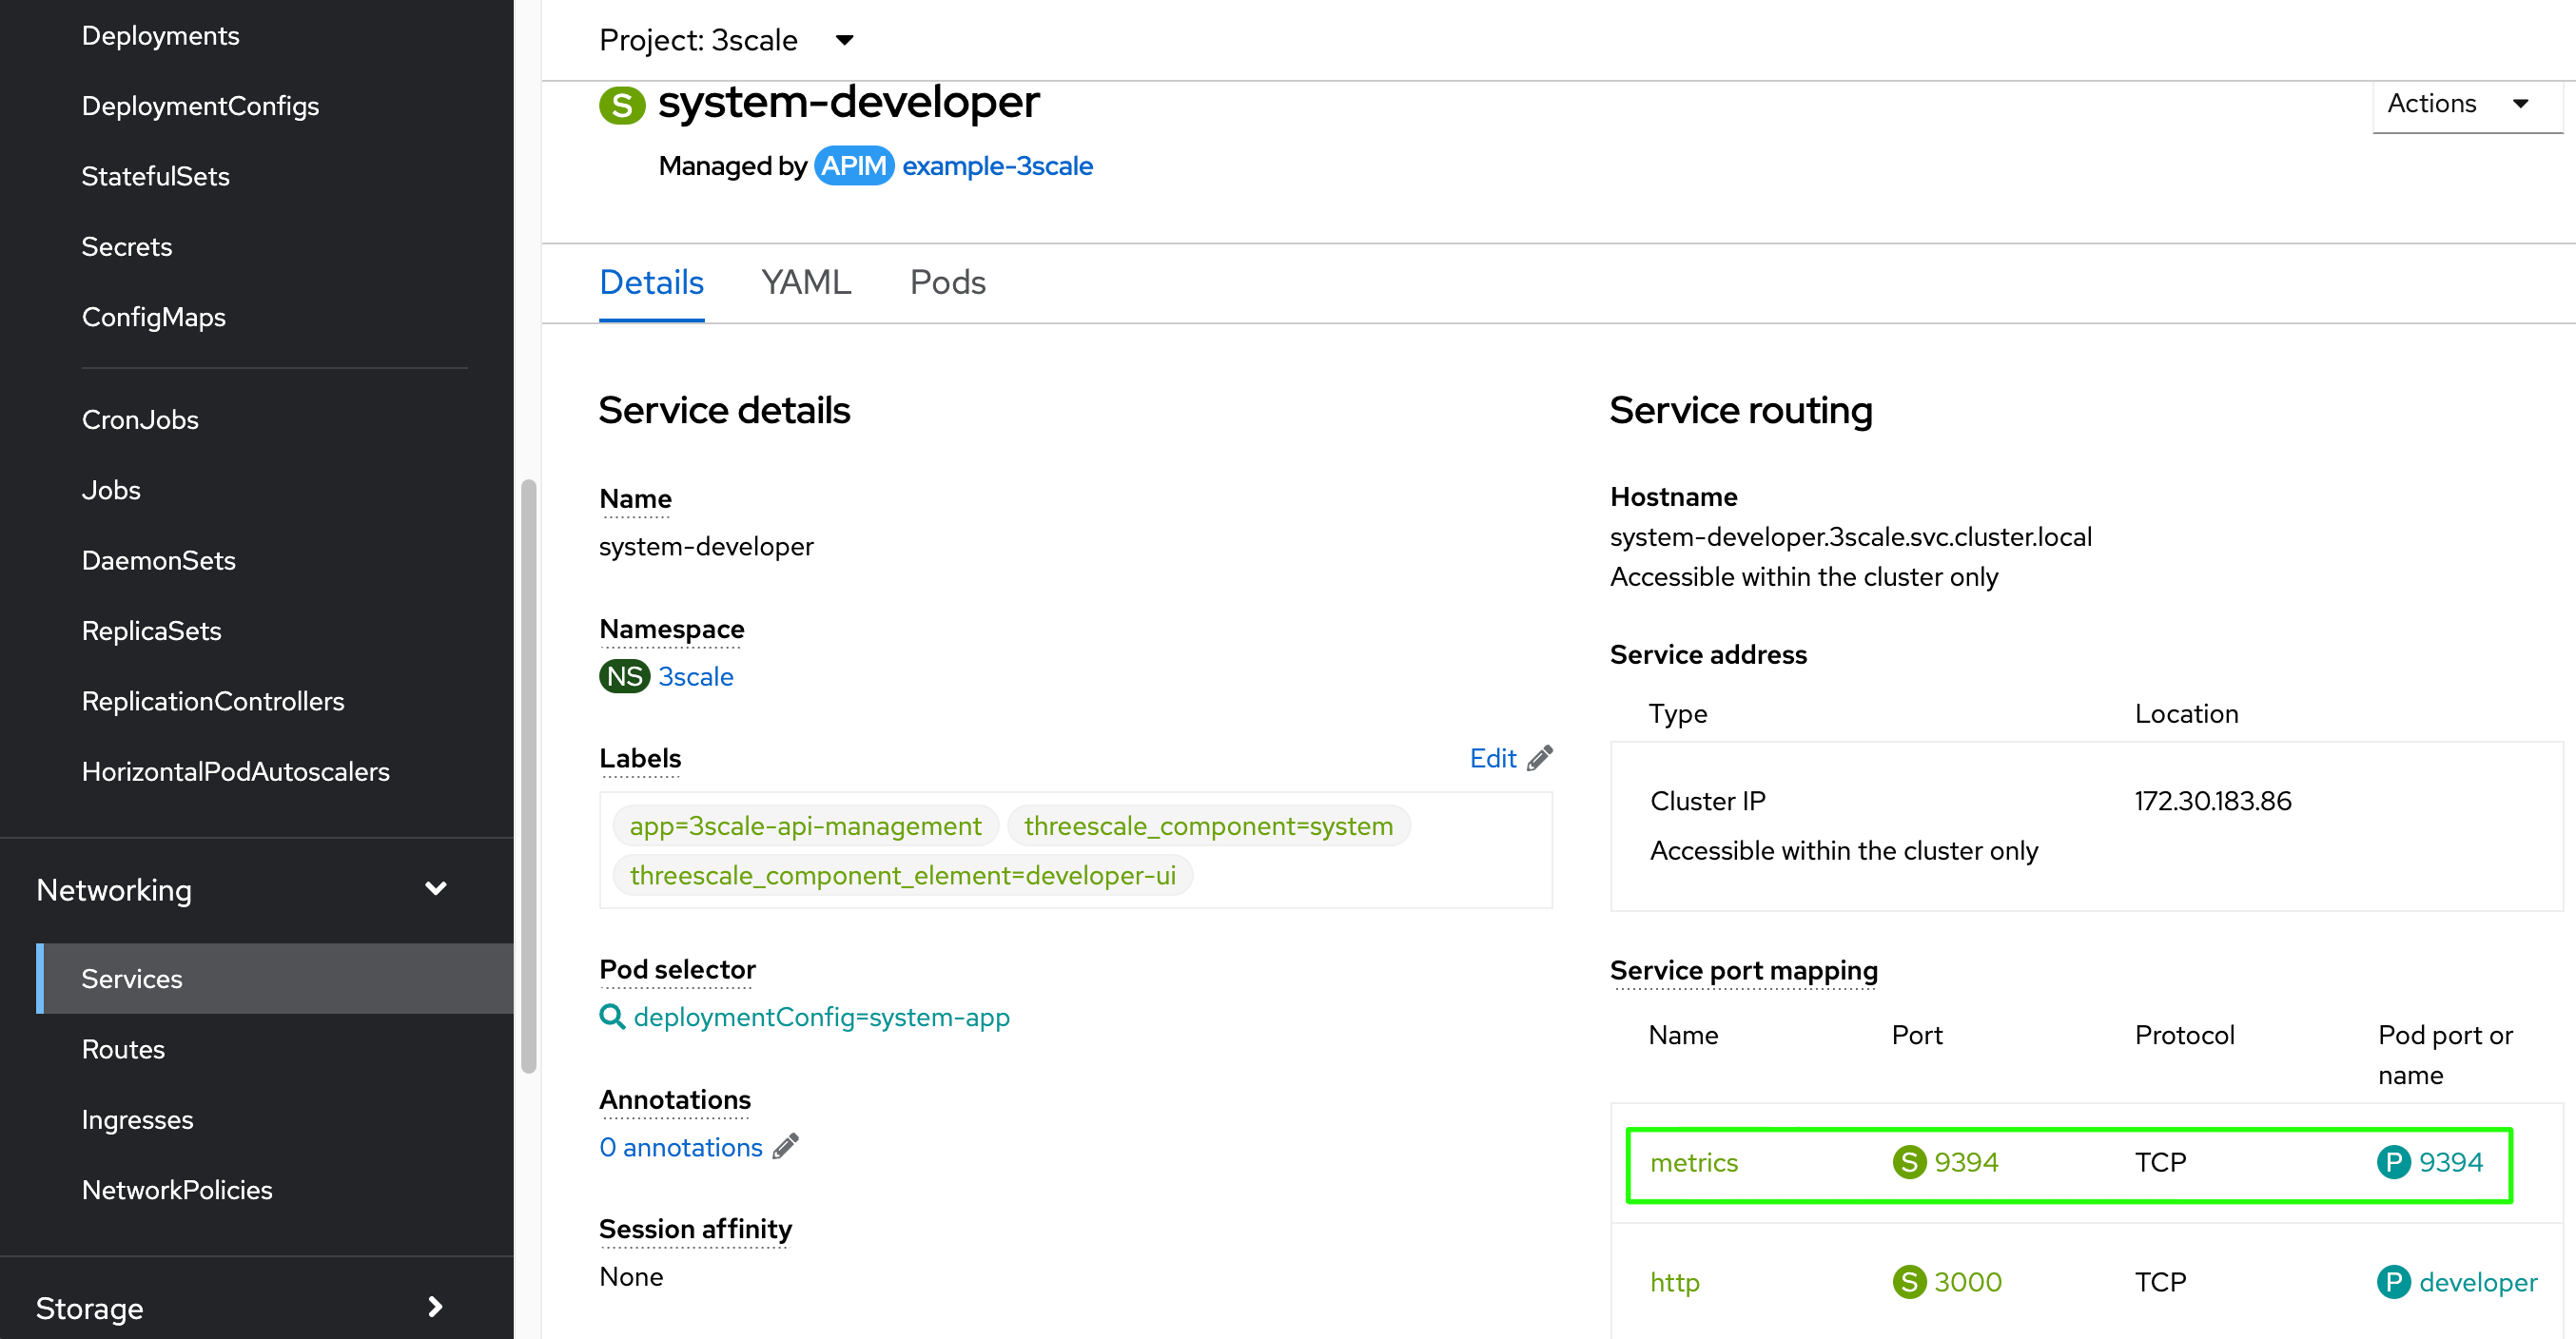
watch oc get po -n openshift-monitoringExpose metrics endpoint for 3Scale components
By default, these components does not expose the /metrics endpoints. The following steps are required to proper monitor them with Prometheus and Grafana.
oc patch svc/system-developer -p '{"spec":{"ports":[{"name":"metrics","port":9394,"protocol":"TCP","targetPort":9394}]}}' -n $MANAGER_NS
oc patch svc/system-master -p '{"spec":{"ports":[{"name":"metrics","port":9395,"protocol":"TCP","targetPort":9395}]}}' -n $MANAGER_NS
oc patch svc/system-provider -p '{"spec":{"ports":[{"name":"metrics","port":9396,"protocol":"TCP","targetPort":9396}]}}' -n $MANAGER_NS
oc expose dc system-sidekiq --name=metrics-system-sidekiq --port=9394 -n $MANAGER_NS
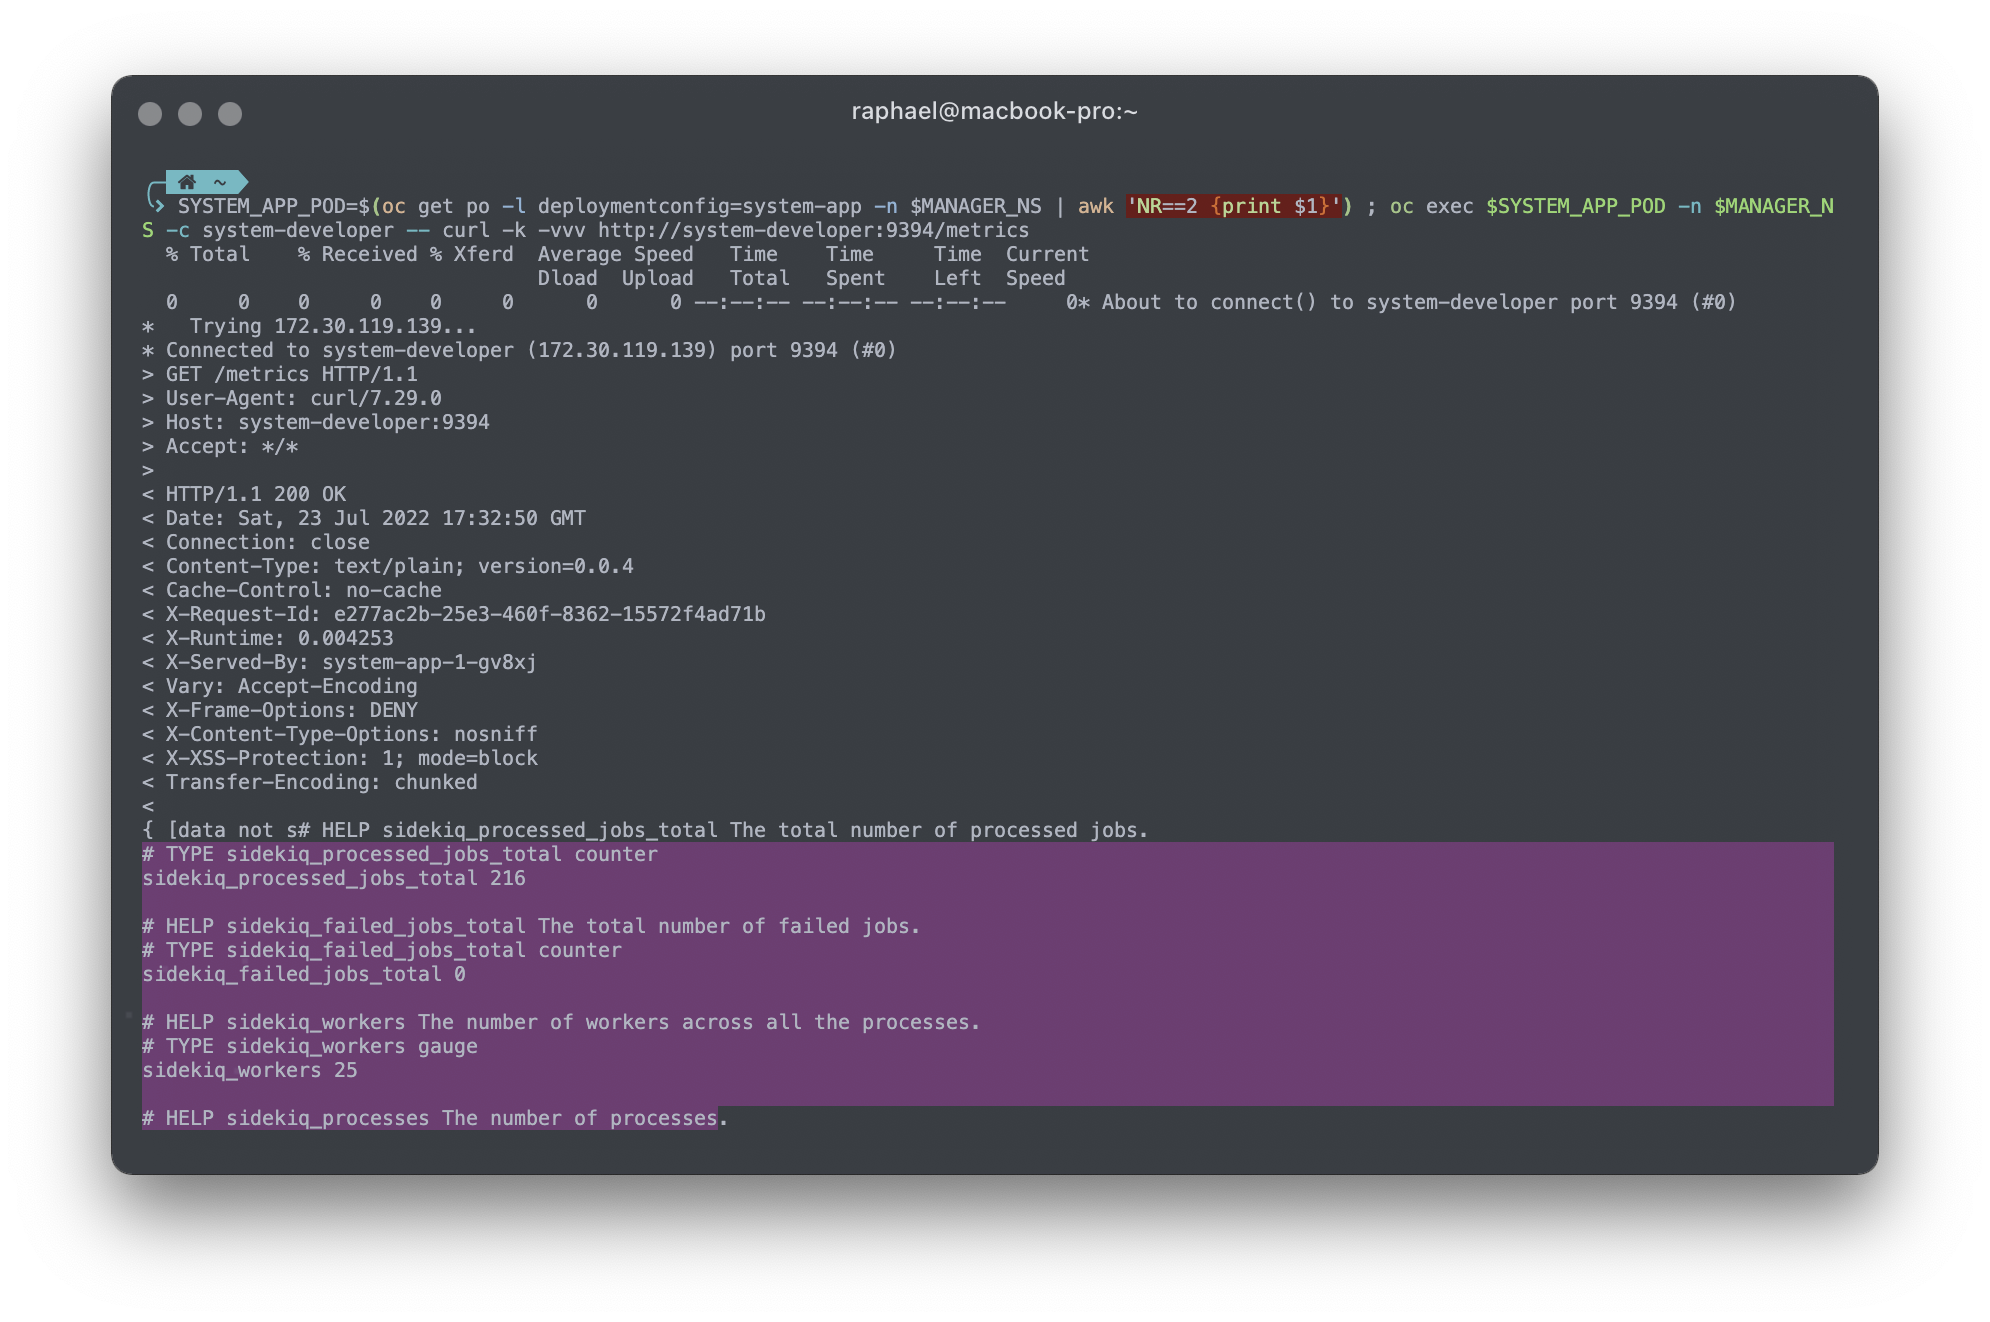
oc patch svc/metrics-system-sidekiq -p '{"spec":{"ports":[{"name":"metrics","port":9394,"protocol":"TCP","targetPort":"metrics"}]}}' -n $MANAGER_NSAfter that, you might want to test those endpoints by giving an http call. For example, go over the terminal and hit the following command to check system-developer container Prometheus metrics:
SYSTEM_APP_POD=$(oc get po -l deploymentconfig=system-app -n $MANAGER_NS | awk 'NR==2 {print $1}') ; oc exec $SYSTEM_APP_POD -n $MANAGER_NS -c system-developer -- curl -k -vvv http://system-developer:9394/metrics
Expose metrics endpoint for 3Scale APICast component
By default, Prometheus can monitor all metrics as stated in section 9.2 Prometheus Default Metrics for 3scale APIcast
note: If a metric dont have any current value, it can be ommited and/or Prometheus would not show any information.
Example:
if the metric nginx_error_log doesn’t not have any errors to be reported, Prmetheus reserves the right to not display it.
APICast OLM managed
# including 3scale namespace also, as it holds APICast instances too
export APICAST_NSS=("3scale" "3scale-apicast-intranet" "3scale-apicast-internet" "3scale-apicast-mobile")
echo "Updating APICast services. This operation could take a while. \n---------------------------------------------------------------"; \
for x in "${APICAST_NSS[@]}"; do \
if [ "$x" = "$MANAGER_NS" ]; then \
echo ":: 3Scale default APICast"
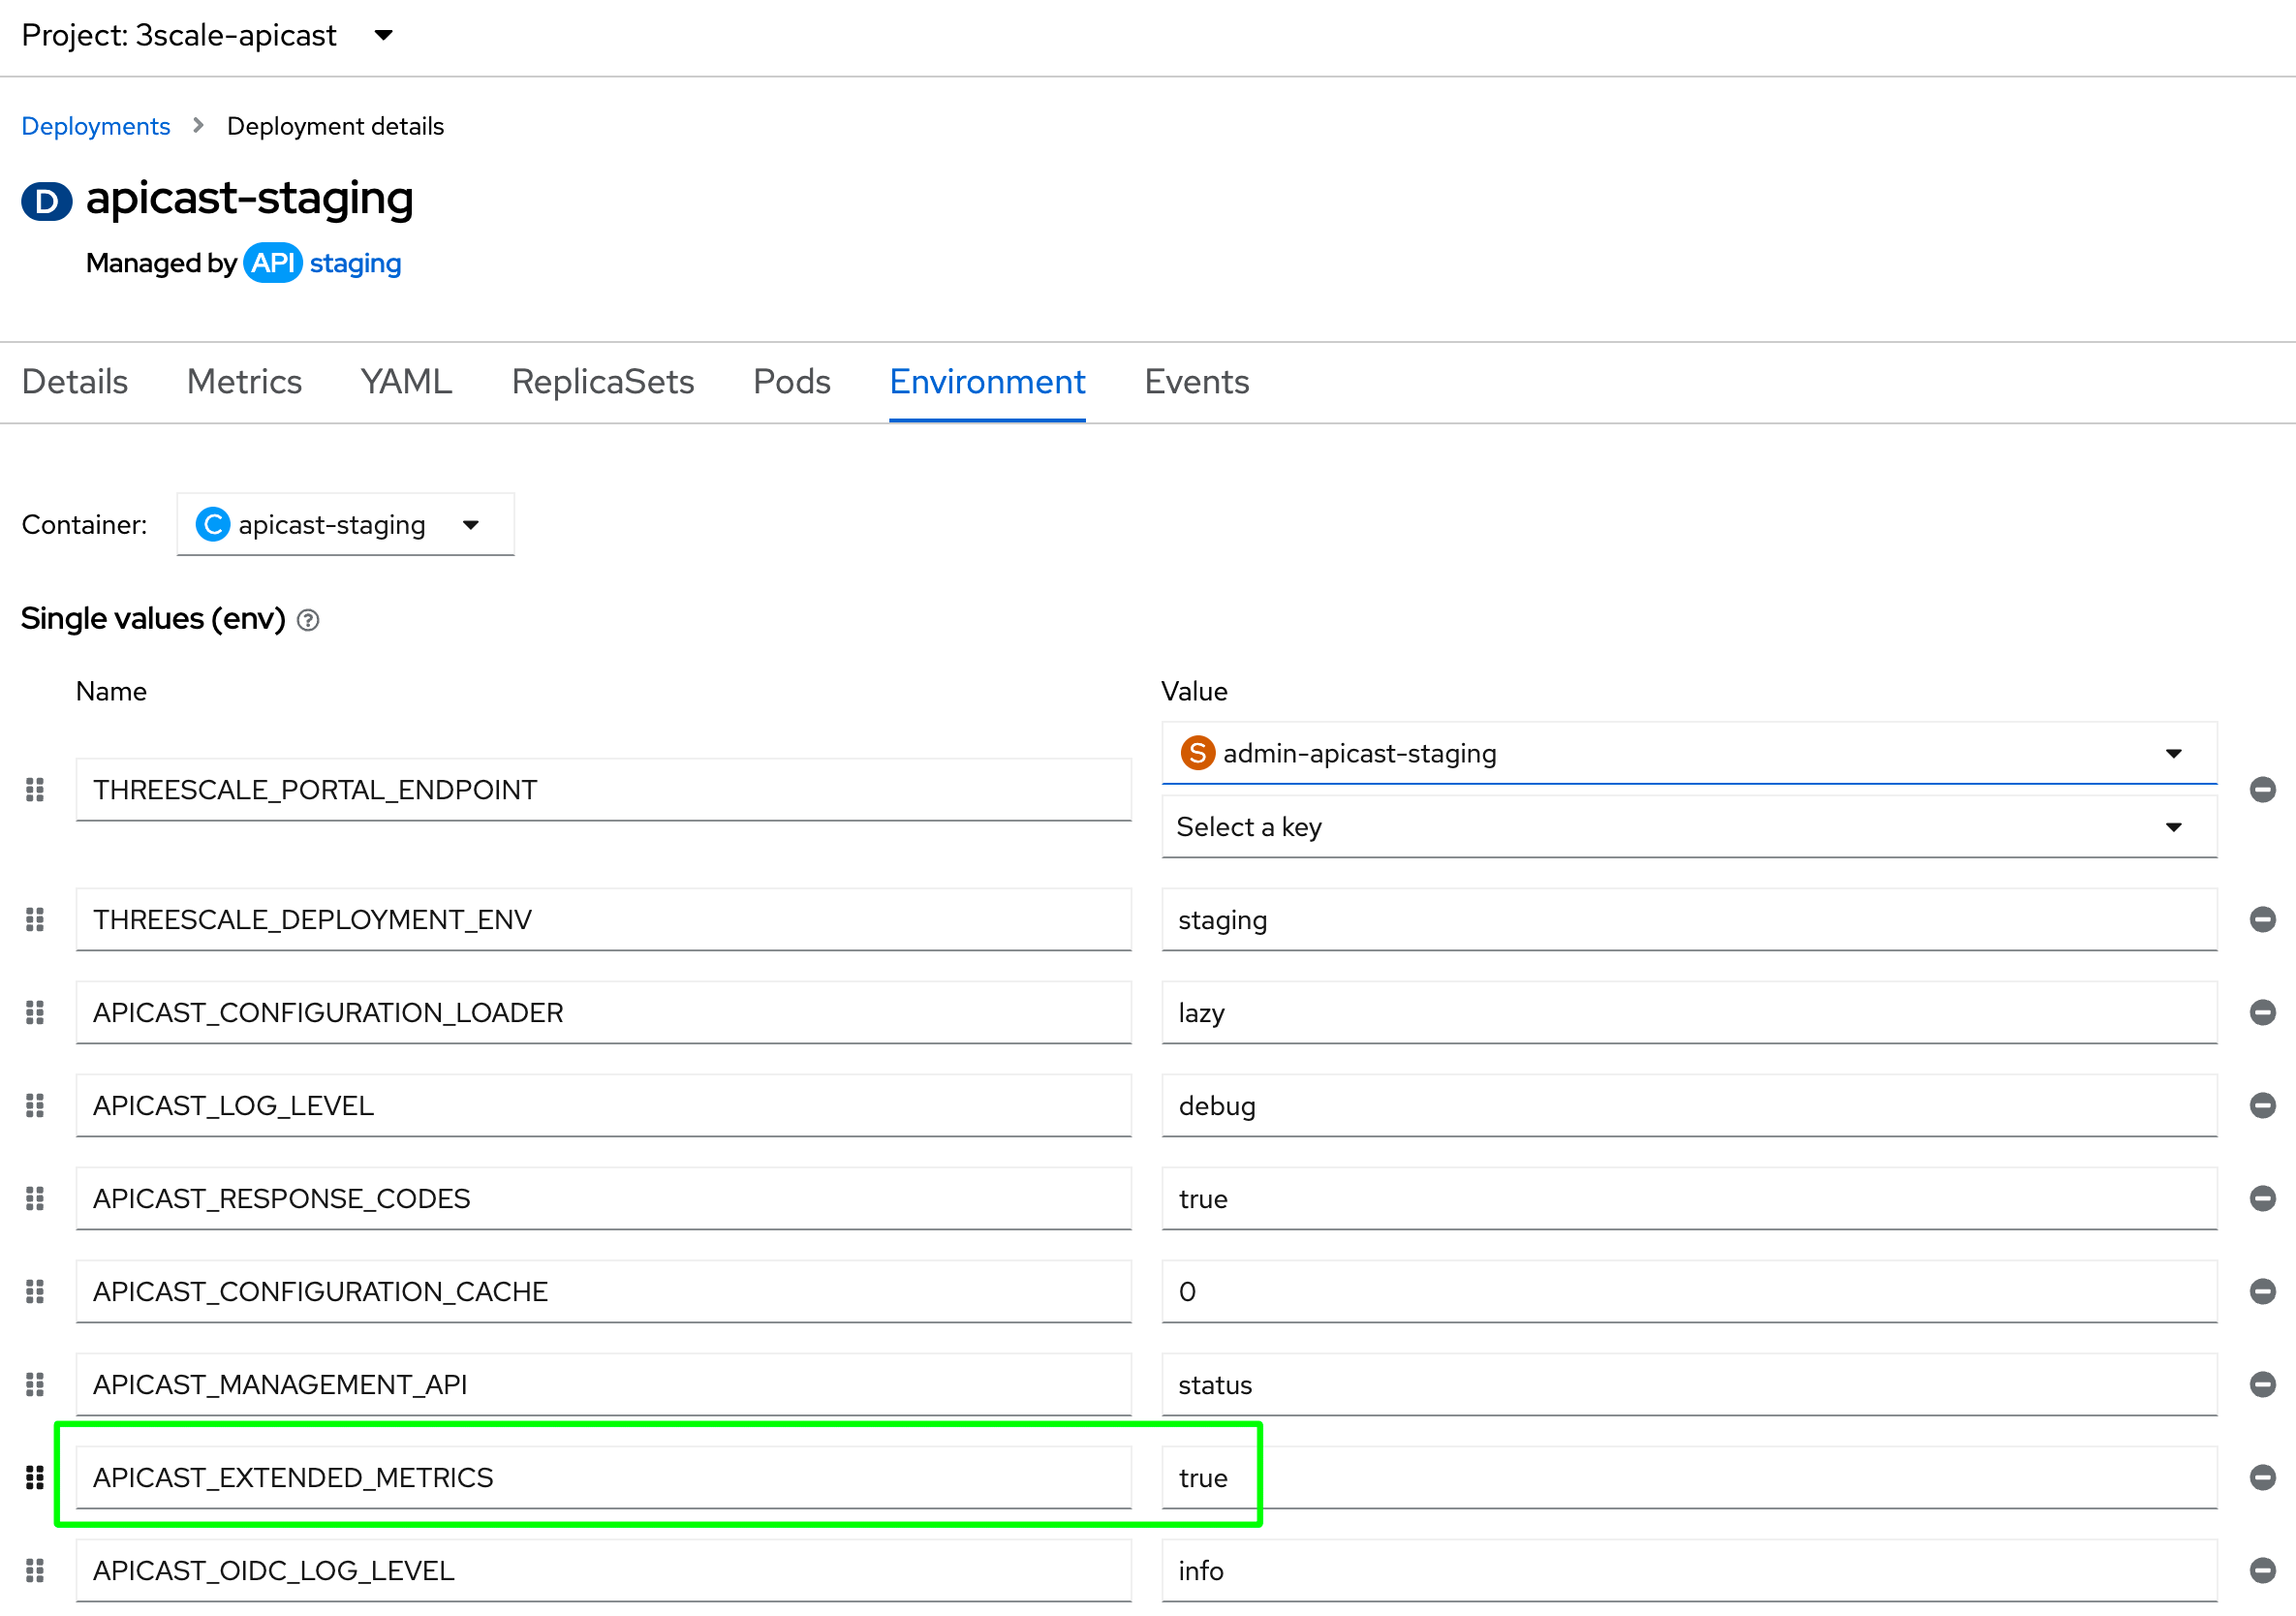
STG_GTW=$(oc get dc -l threescale_component=apicast -l threescale_component_element=staging -n $x | awk 'NR==2 {print $1}'); \
oc set env dc/$STG_GTW APICAST_EXTENDED_METRICS=true -n $x; \
PRD_GTW=$(oc get dc -l threescale_component=apicast -l threescale_component_element=production -n $x | awk 'NR==2 {print $1}'); \
oc set env dc/$PRD_GTW APICAST_EXTENDED_METRICS=true -n $x; \
sleep 2; \
oc delete svc metrics-staging-apicast -n $x; \
oc delete svc metrics-production-apicast -n $x; \
oc expose dc/apicast-staging --name=metrics-staging-apicast --port=9421 -n $x; \
oc expose dc/apicast-production --name=metrics-production-apicast --port=9421 -n $x; \
else
echo ":: 3Scale APICast at $x namespace"
oc label namespace $x monitoring=apicast; \
oc patch APICast/staging-apicast --type merge -p '{"spec":{"extendedMetrics":true}}' -n $x; \
oc patch APICast/production-apicast --type merge -p '{"spec":{"extendedMetrics":true}}' -n $x; \
sleep 2; \
oc delete svc metrics-staging-apicast -n $x; \
oc delete svc metrics-production-apicast -n $x; \
oc expose deployment apicast-staging-apicast --name=metrics-staging-apicast --port=9421 -n $x; \
oc expose deployment apicast-production-apicast --name=metrics-production-apicast --port=9421 -n $x; \
fi
sleep 2; \
oc label svc metrics-staging-apicast monitoring=apicast -n $x; \
oc patch svc/metrics-staging-apicast -p '{"spec":{"ports":[{"name":"metrics","port":9421,"protocol":"TCP","targetPort":"metrics"}]}}' -n $x; \
oc label svc metrics-production-apicast monitoring=apicast -n $x; \
oc patch svc/metrics-production-apicast -p '{"spec":{"ports":[{"name":"metrics","port":9421,"protocol":"TCP","targetPort":"metrics"}]}}' -n $x; \
echo "$x APICast instances successfully updated! \n\n"; \
done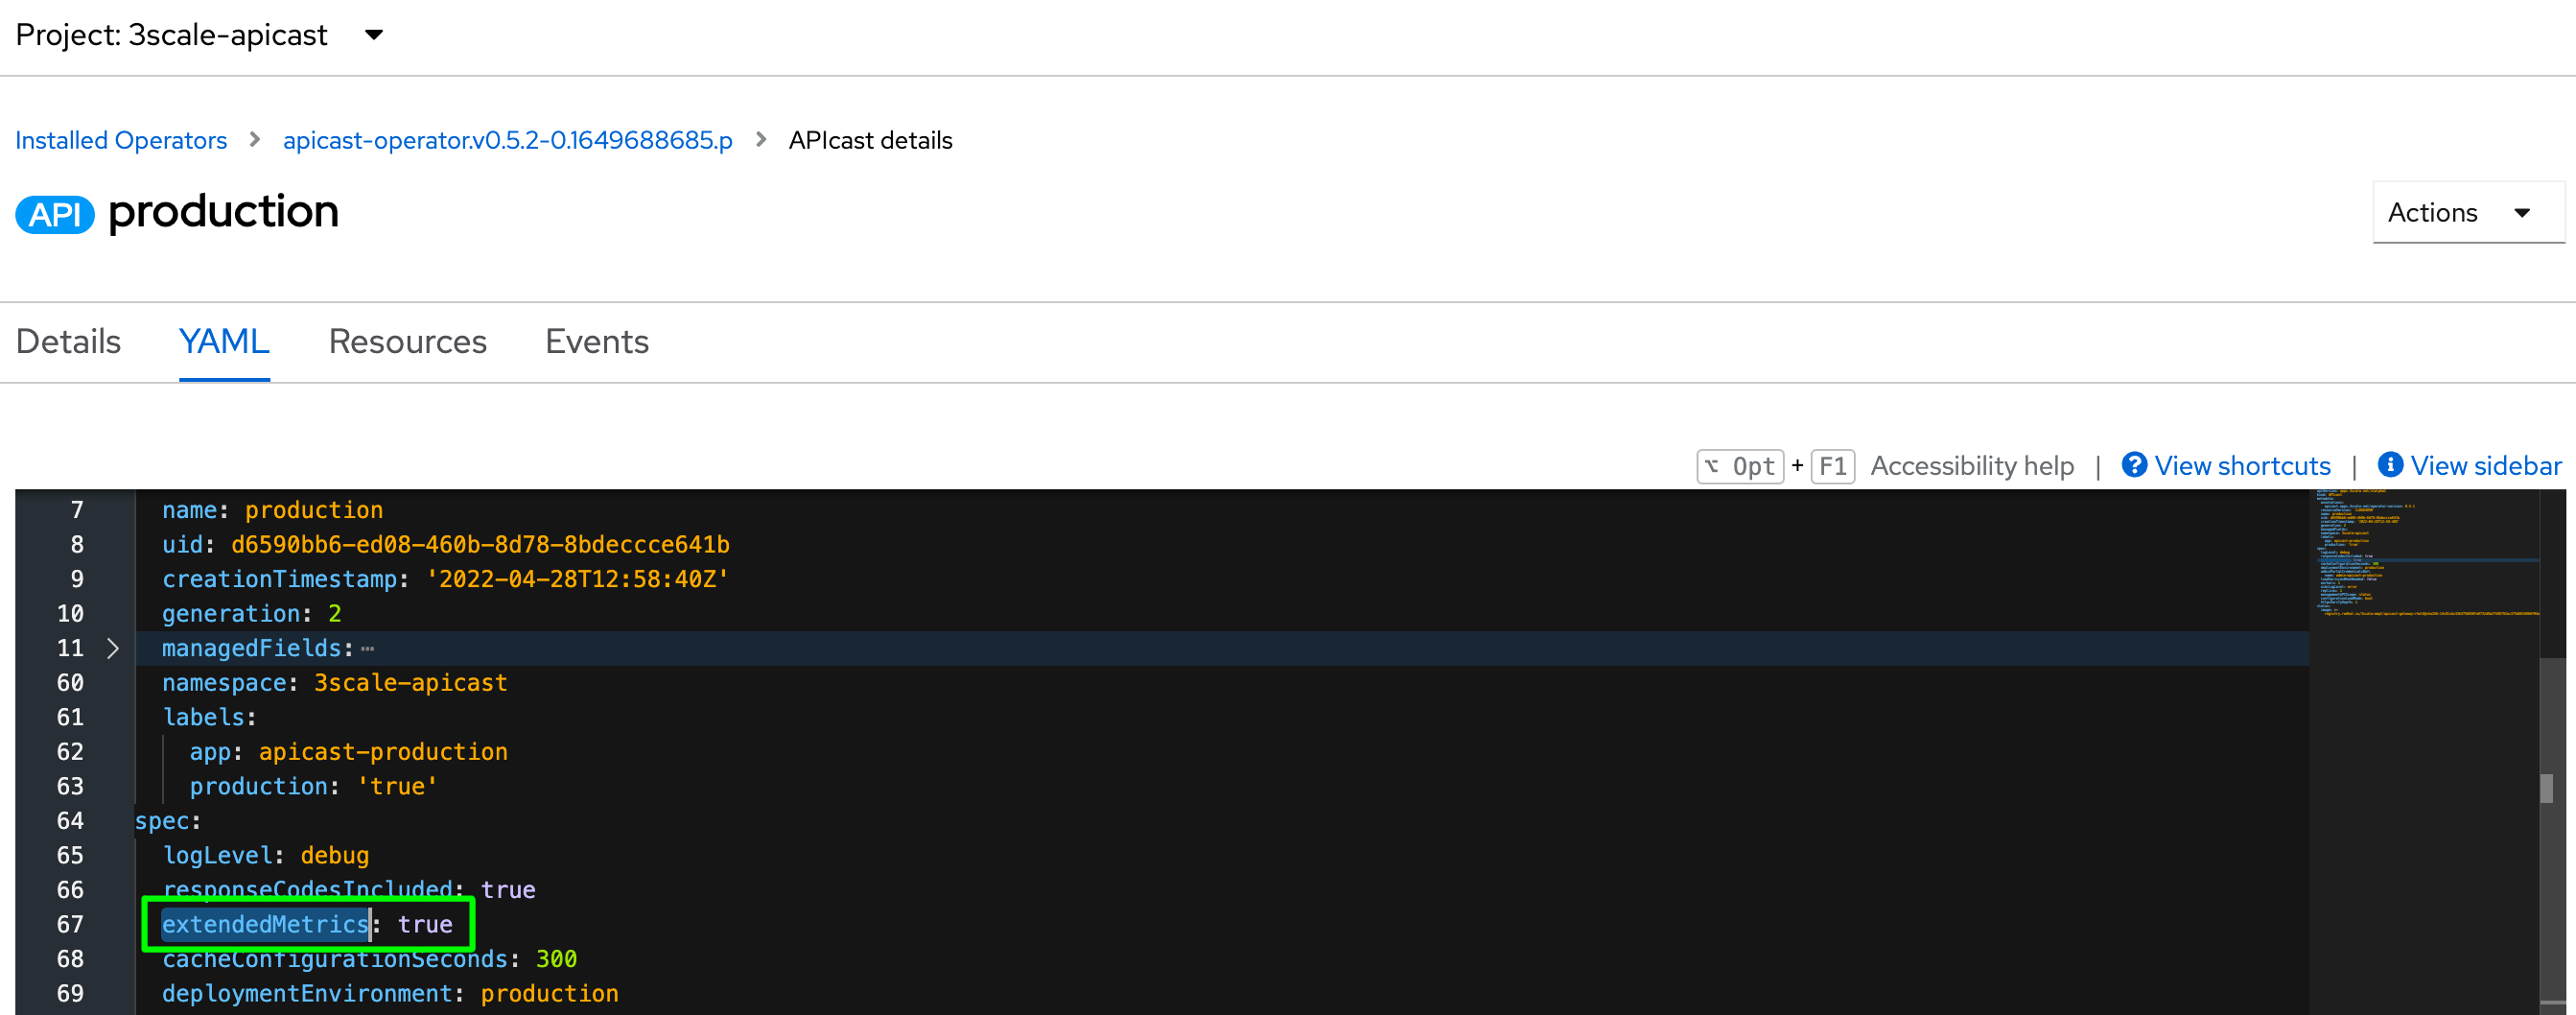
The APICAST_EXTENDED_METRICS has a boolean value that enables the exposure of additional metrics to Prometheus. The following metrics uses the labels service_id and service_system_name to provide additional information from APICast:
total_response_time_secondsupstream_response_time_secondsupstream_status
Deploy a ServiceMonitor Custom Resource for external APICast namespaces
# remove 3scale as it already has a service monitor
export APICAST_NSS=("3scale-apicast-intranet" "3scale-apicast-internet" "3scale-apicast-mobile")
echo "Deploying APICast ServiceMonitor. This operation could take a while. \n---------------------------------------------------------------"; \
for x in "${APICAST_NSS[@]}"; do \
oc delete servicemonitor prometheus-apicast-monitor -n $x; \
cat > apicast-service-monitor.yaml <<EOL
apiVersion: monitoring.coreos.com/v1
kind: ServiceMonitor
metadata:
labels:
k8s-app: prometheus-apicast-monitor
name: prometheus-apicast-monitor
namespace: $x
spec:
namespaceSelector:
matchNames:
- $x
selector:
matchLabels:
app: apicast
monitoring: apicast
endpoints:
- interval: 5s
path: /metrics
port: metrics
scheme: http
EOL
oc apply -f apicast-service-monitor.yaml -n $x; \
echo "$x ServiceMonitor successfully deployed! \n\n"; \
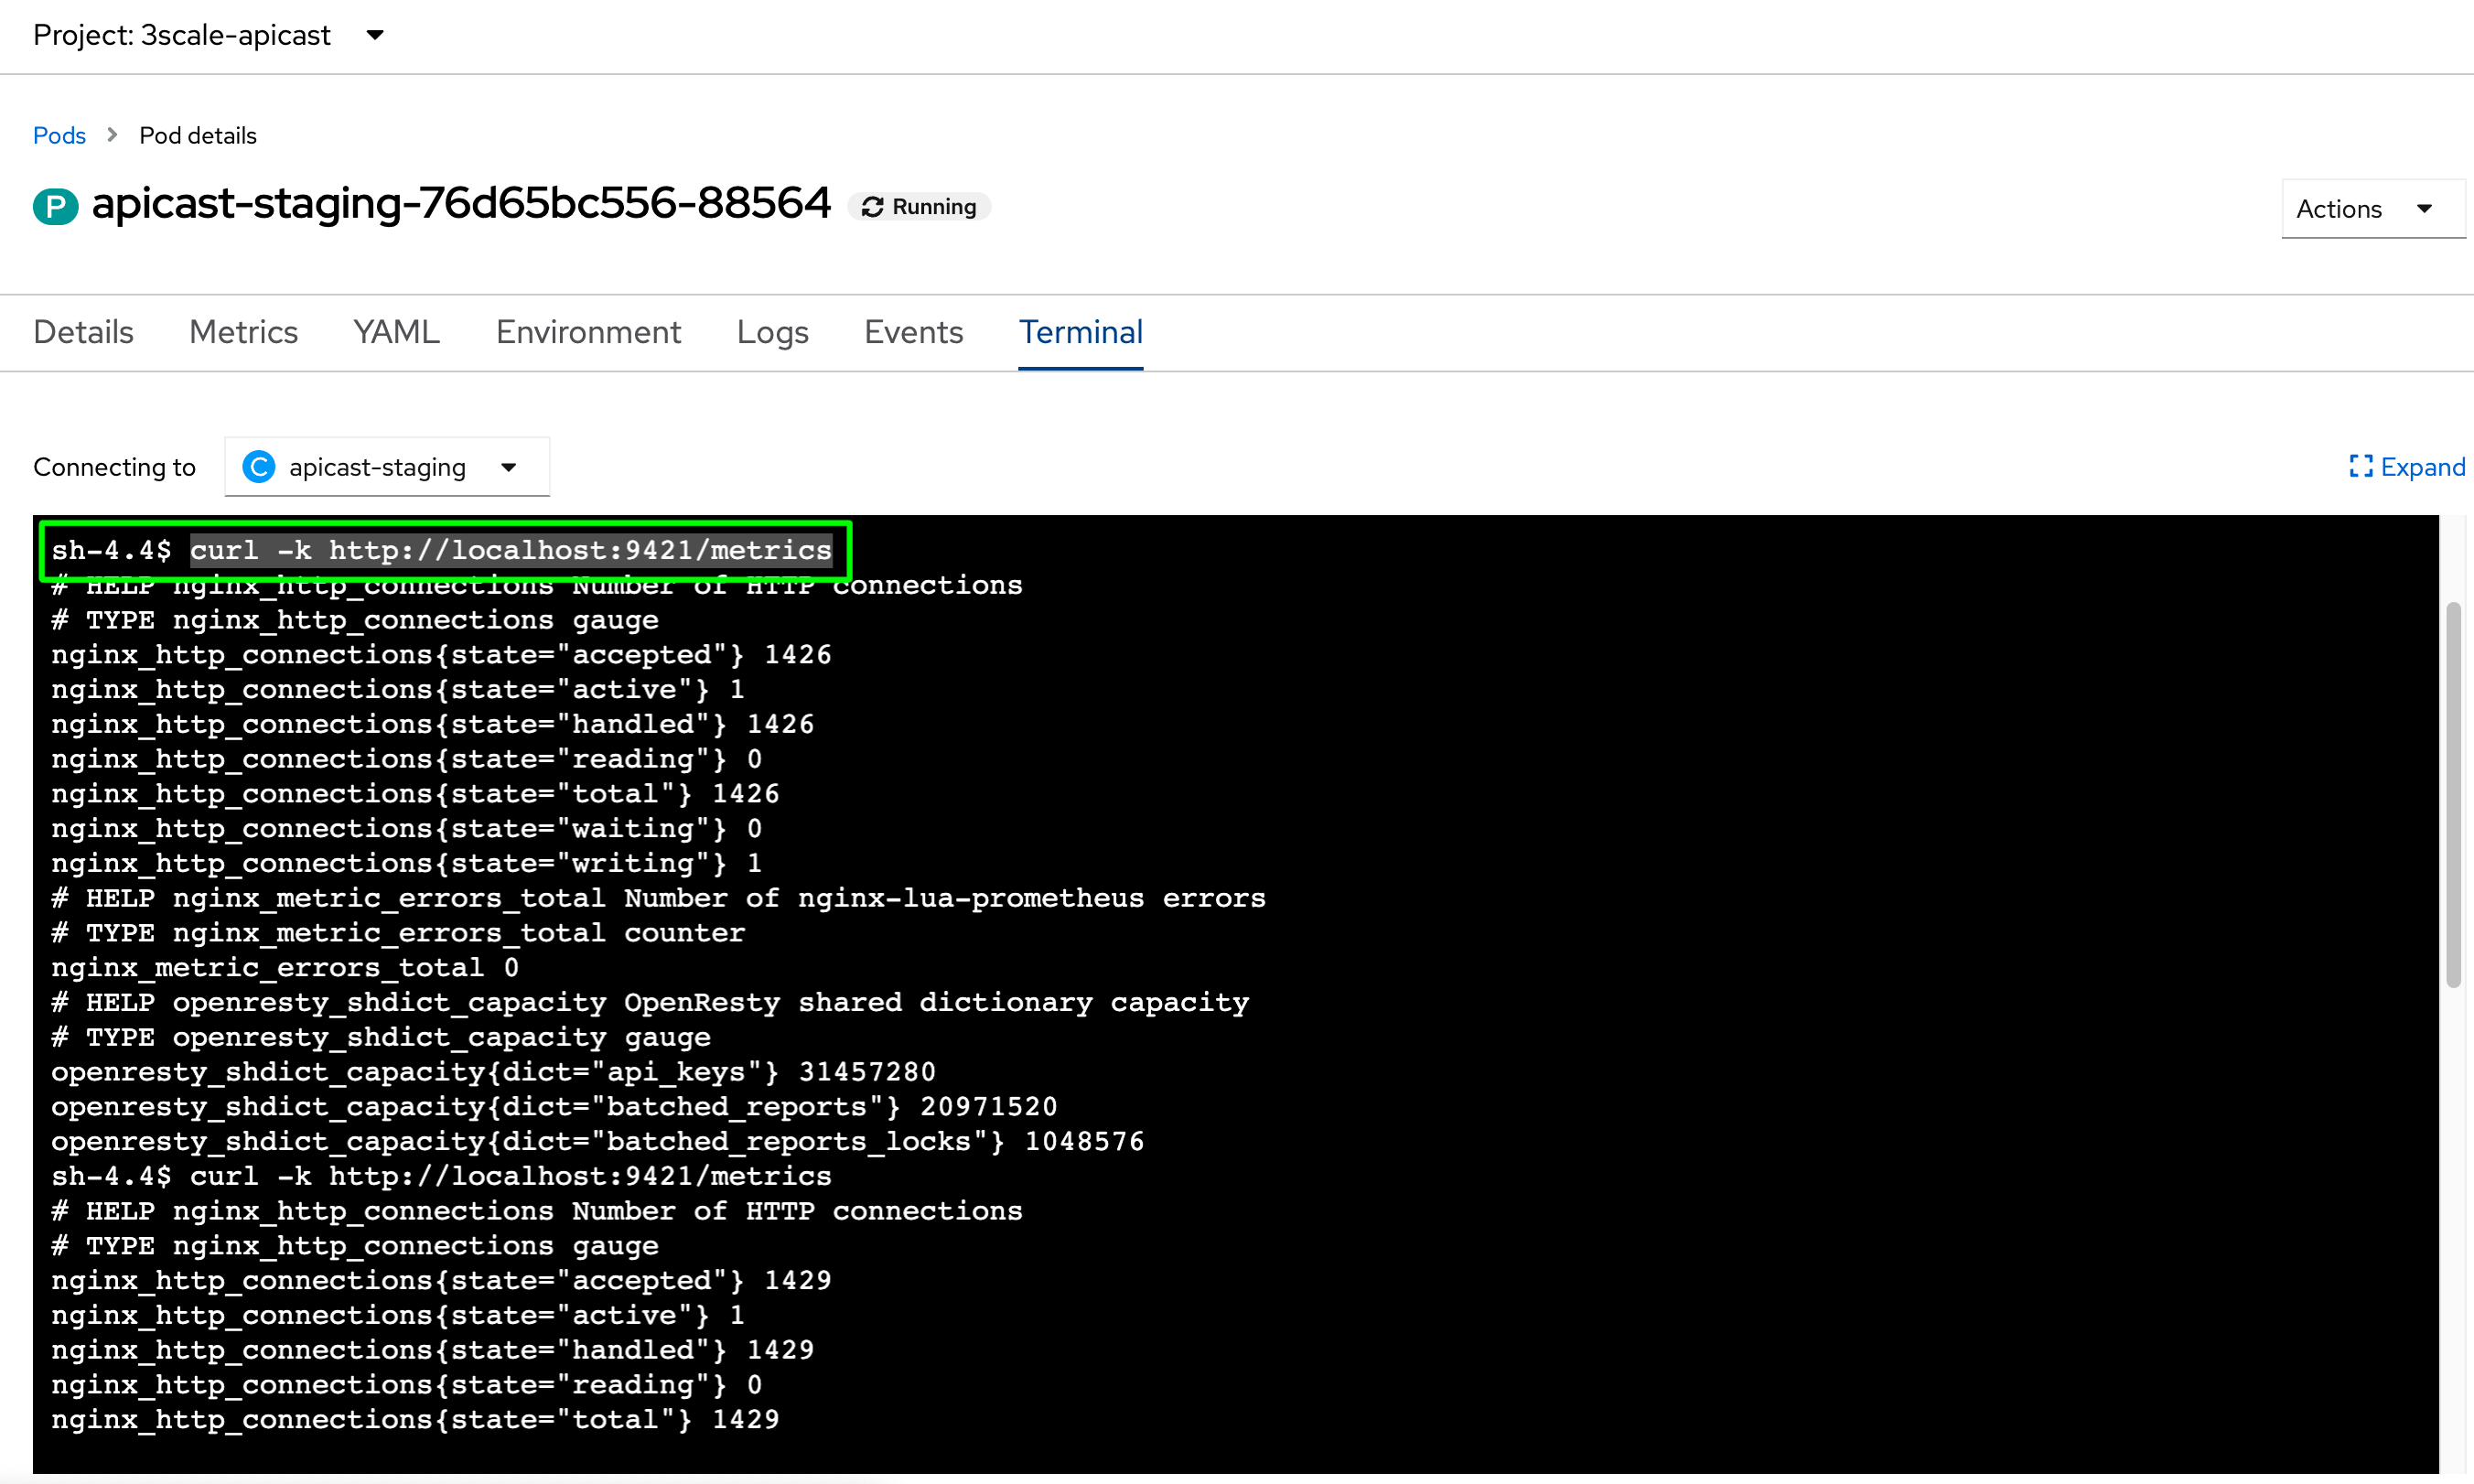
doneOptional: Test APICast metrics endpoint
If you want to try the metrics endpoint, just hit the following block at the terminal:
# including 3scale namespace also, as it holds APICast instances too
export APICAST_NSS=("3scale" "3scale-apicast-intranet" "3scale-apicast-internet" "3scale-apicast-mobile")

echo "Testing APICast Prometheus endpoints. This operation could take a while. \n------------------------------------------------------------------------"; \
for x in "${APICAST_NSS[@]}"; do \
echo ":: $x APICast (env=staging)"; \
APICAST_STG_POD=$(oc get po -l deploymentconfig=apicast-staging -n $x | awk 'NR==2 {print $1}') ; oc exec $APICAST_STG_POD -n $x -c apicast-staging -- curl -k -vvv http://localhost:9421/metrics
echo "\n"; \
echo ":: $x APICast (env=production)"; \
APICAST_PRD_POD=$(oc get po -l deploymentconfig=apicast-production -n $x | awk 'NR==2 {print $1}') ; oc exec $APICAST_PRD_POD -n $x -c apicast-production -- curl -k -vvv http://localhost:9421/metrics
echo "\n"; \
done
echo "End of execution."
Deploy Grafana
Grafana can be provisioned in the same namespace as 3Scale or in a separate namespace.
The main difference is that when provisioned in the same 3Scale namespace (Kind:APIManager) the 3Scale operator itself also performs the deployment of all 3Scale Grafana Dashboards, if there is already a previously installed Grafana instance.
Other users might choose to have the monitoring stack in another namespace for security purposes. In this scenario, the deployment of 3Scale dashboards must be performed manually. In fact, it is not possible to have the 3Scale operator deplopying Grafana Dashboards in another namespace at this moment.
For this exercise we will deploy Grafana into $MANAGER_MONITORING_NS namespace.
Deploying Grafana in a dedicated namespace
Navigate to $MANAGER_MONITORING_NS and open Operator Hub tab with the Administrator view, and searc’h for grafana operator.
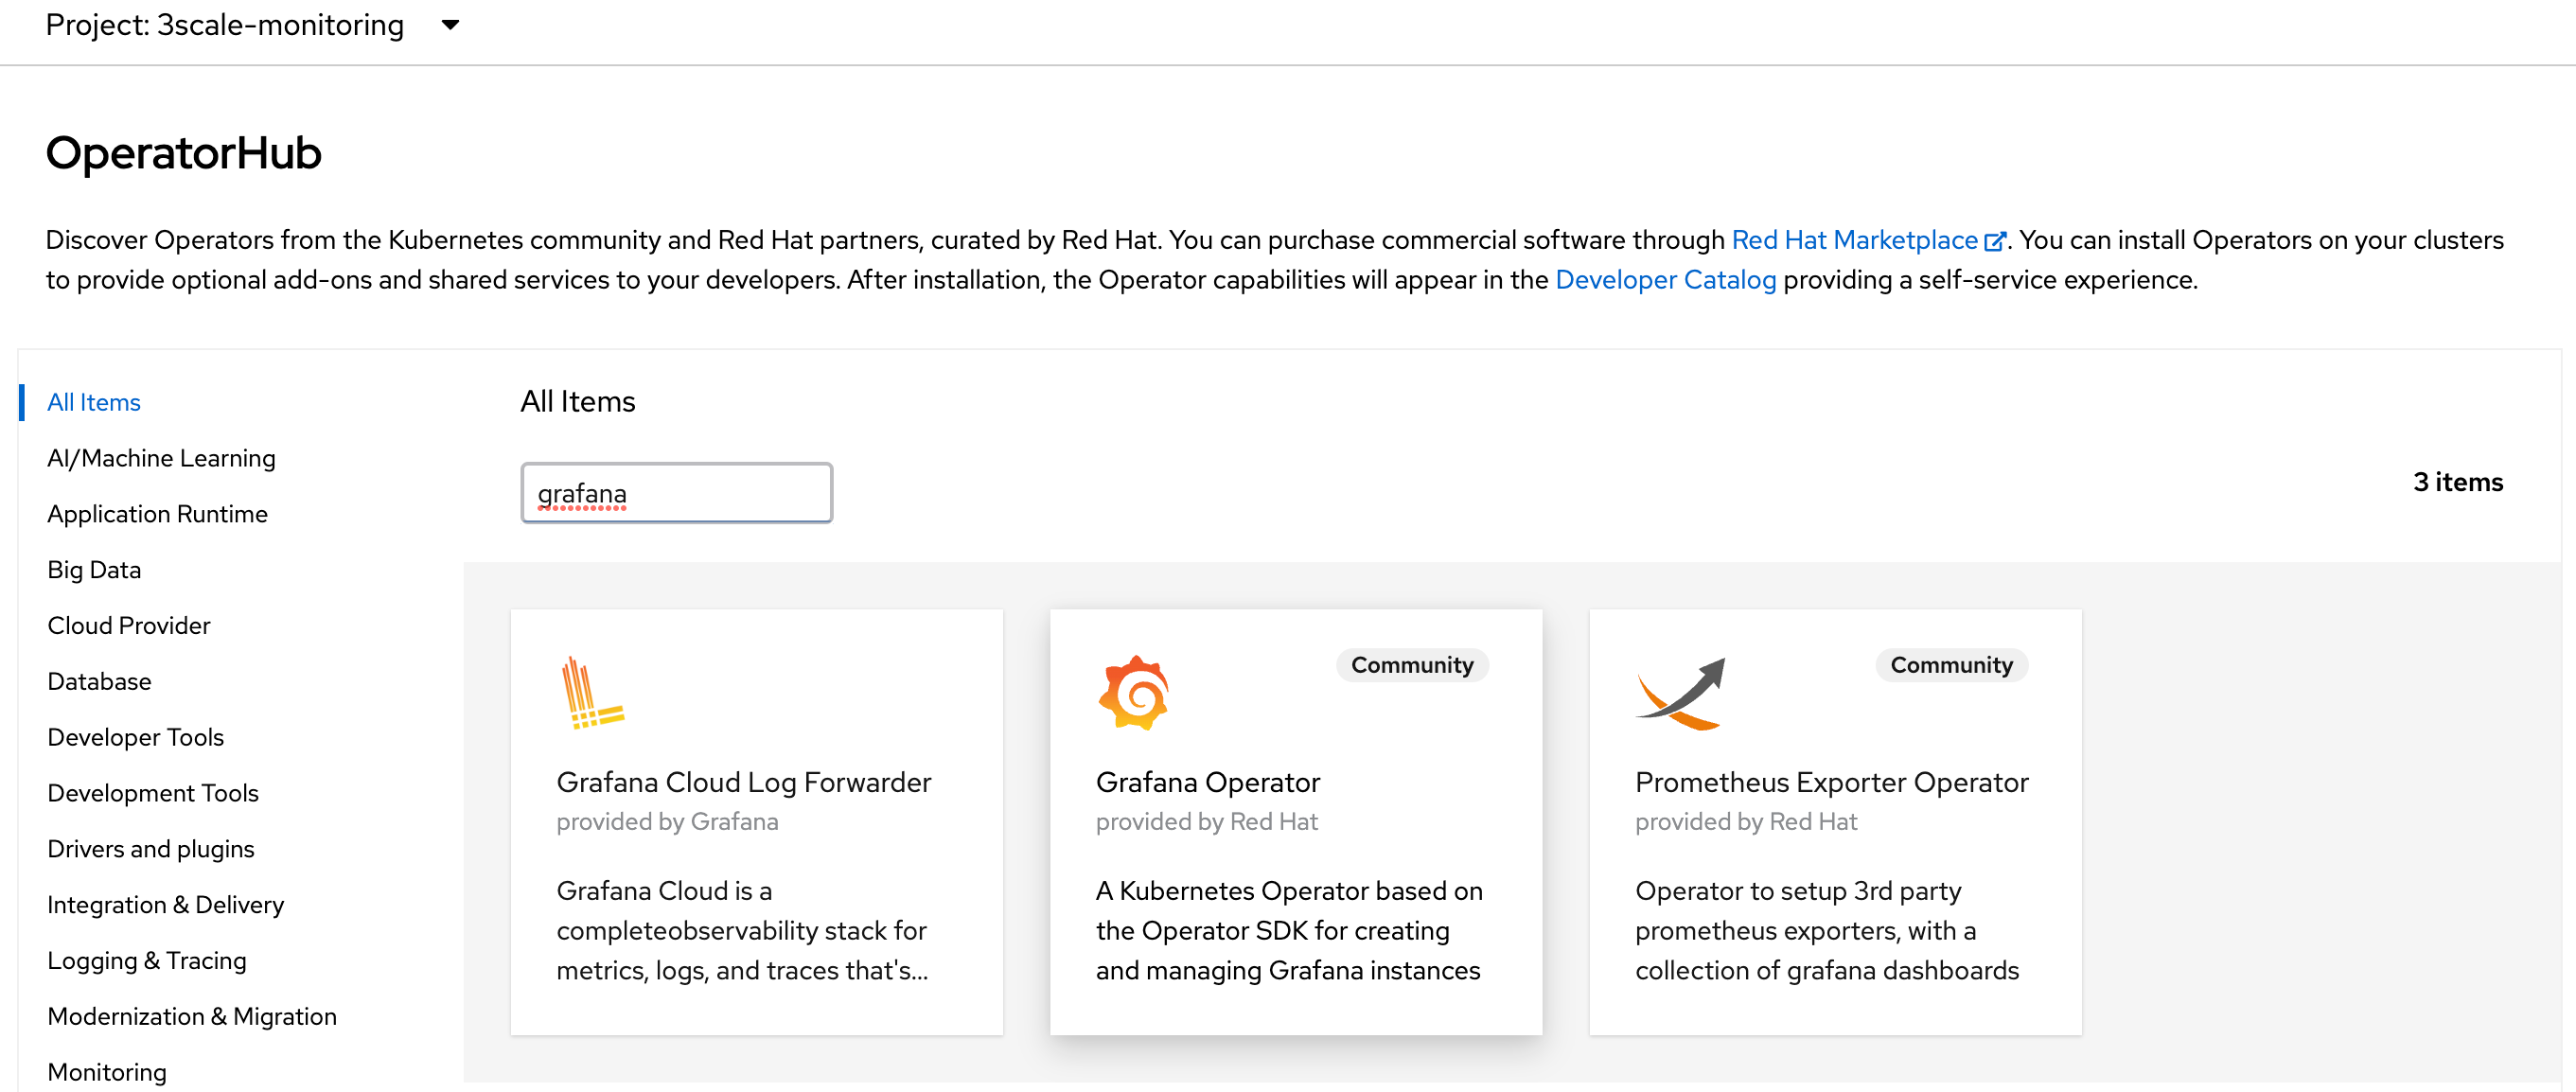
Proceed with the oprator installation as follows:
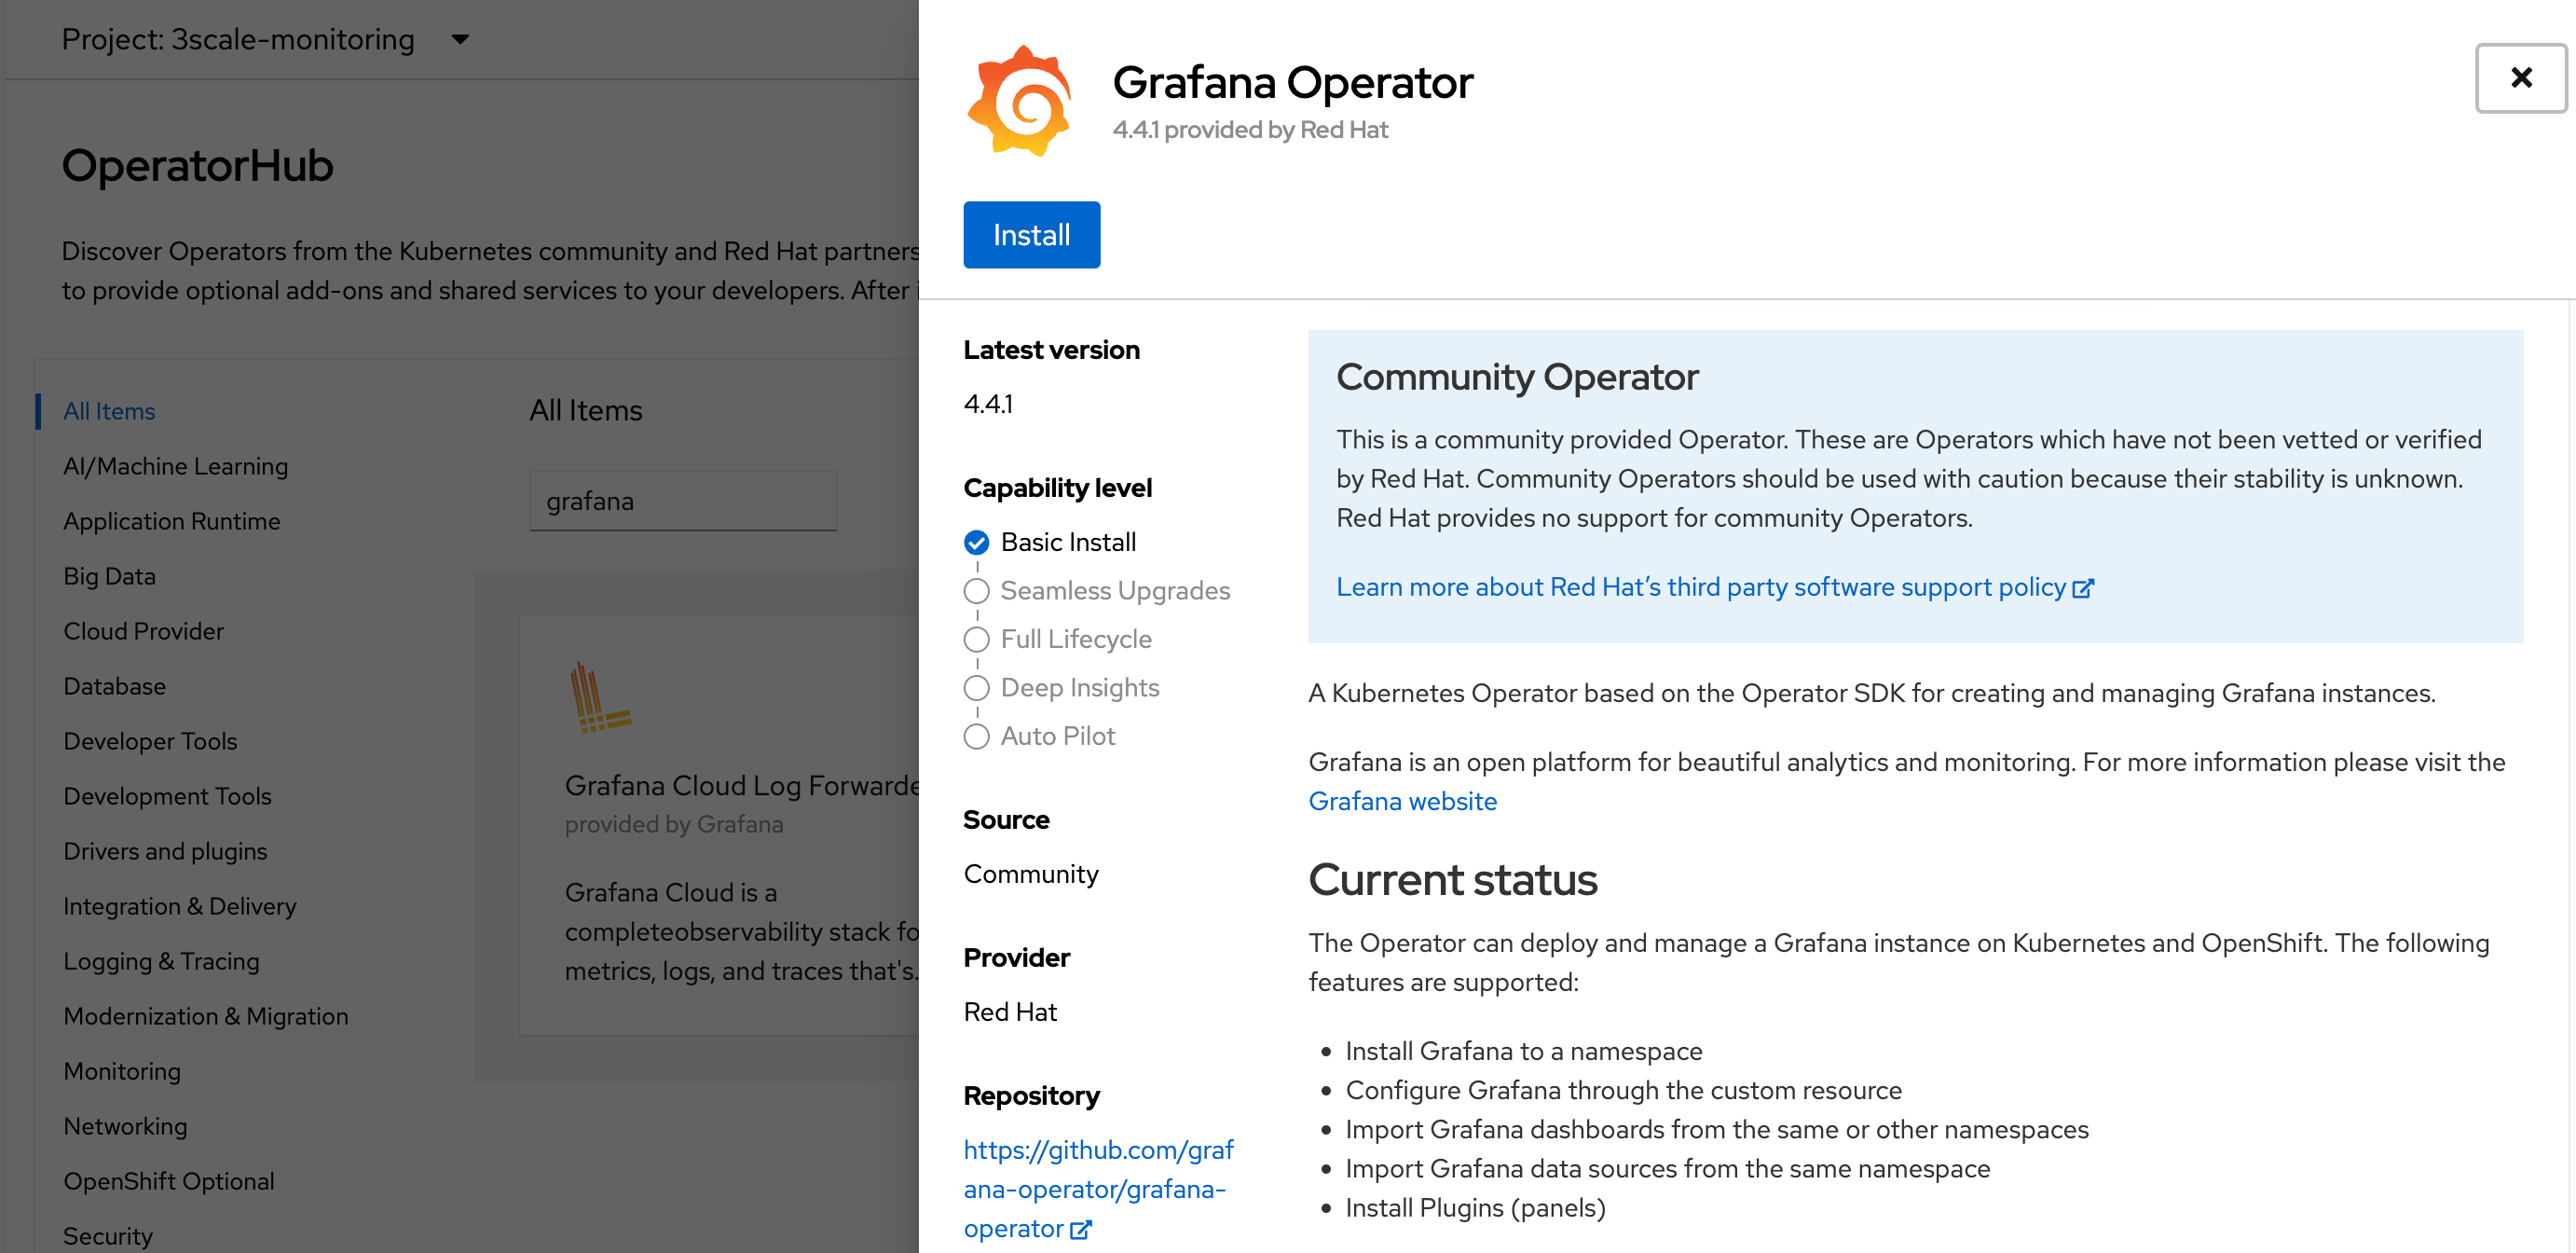
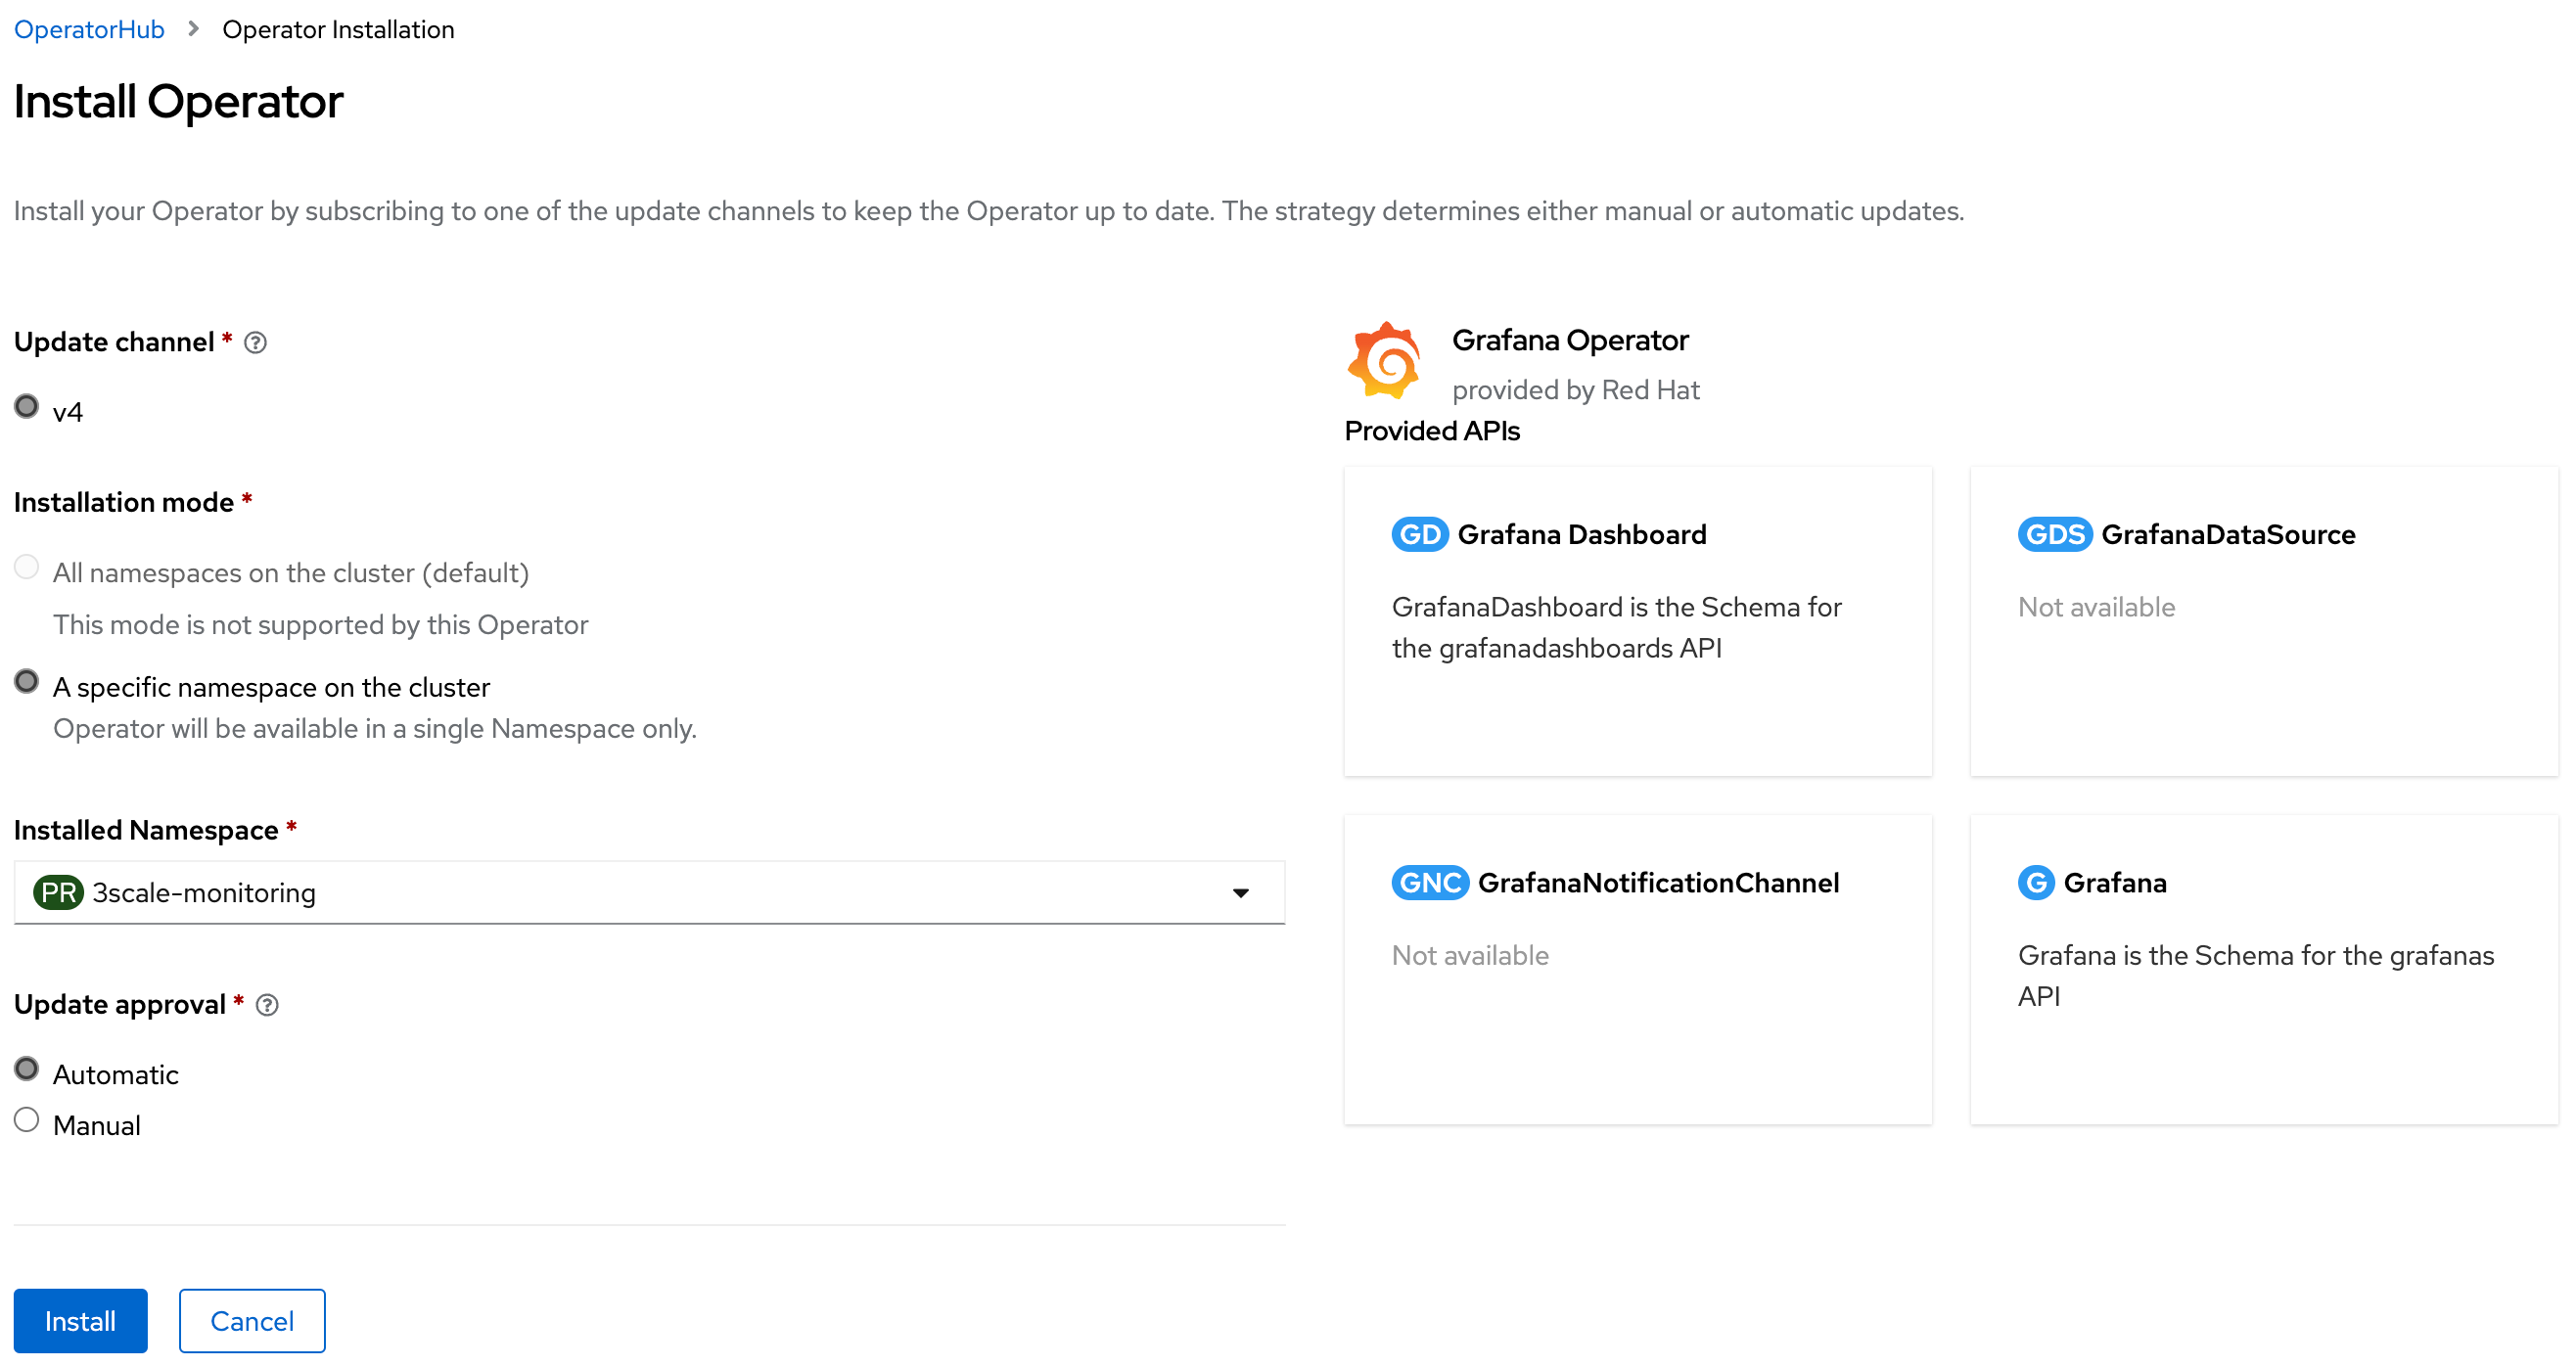
PS. remember to point the installation to $MANAGER_MONITORING_NS.
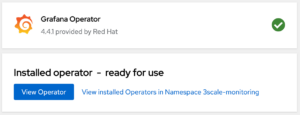
Then, wait for the operator fully deployment:
Deploy Grafana application
With the operator previously installed, review the following yaml file, and proceed with the Grafana deployment.
cat > 3scale-grafana-resource.yaml <<EOL
apiVersion: integreatly.org/v1alpha1
kind: Grafana
metadata:
  name: apm-grafana
spec:
  client:
    preferService: false
    timeout: 10
  config:
    auth:
      disable_login_form: false
      disable_signout_menu: true
    auth.anonymous:
      enabled: true
    log:
      level: warn
      mode: console
    security:
      admin_password: secret
      admin_user: root
  dashboardLabelSelector:
    - matchExpressions:
        - key: app
          operator: In
          values:
            - 3scale-api-management
  ingress:
    enabled: false
  service:
    labels:
      app: grafana
      type: grafana-service
    name: grafana-service
EOLnote: The Grafana admin credentials will be root and secret as defined in the previous yaml file.
note: Grafana will only match and monitor Dashboards that uses the label app with 3scale-api-management value.
Execute the following to deploy Grafana:
oc create -f 3scale-grafana-resource.yaml -n $MANAGER_MONITORING_NS
oc create route edge grafana --service=grafana-service --port=grafana --hostname=grafana-3scale-monitoring.apps.$WILDCARD_DOMAIN --insecure-policy=Allow --wildcard-policy=None -n $MANAGER_MONITORING_NS
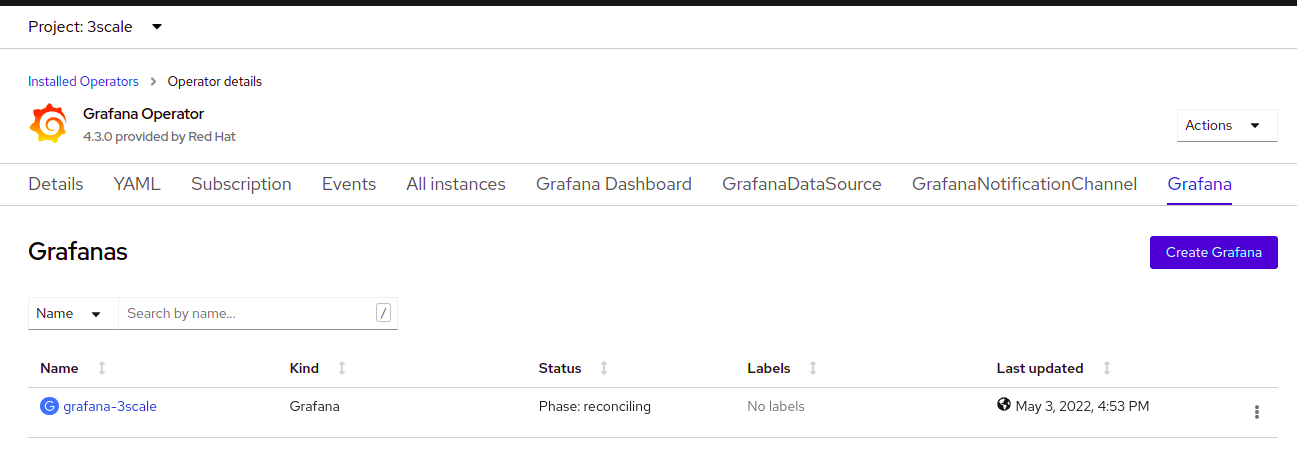
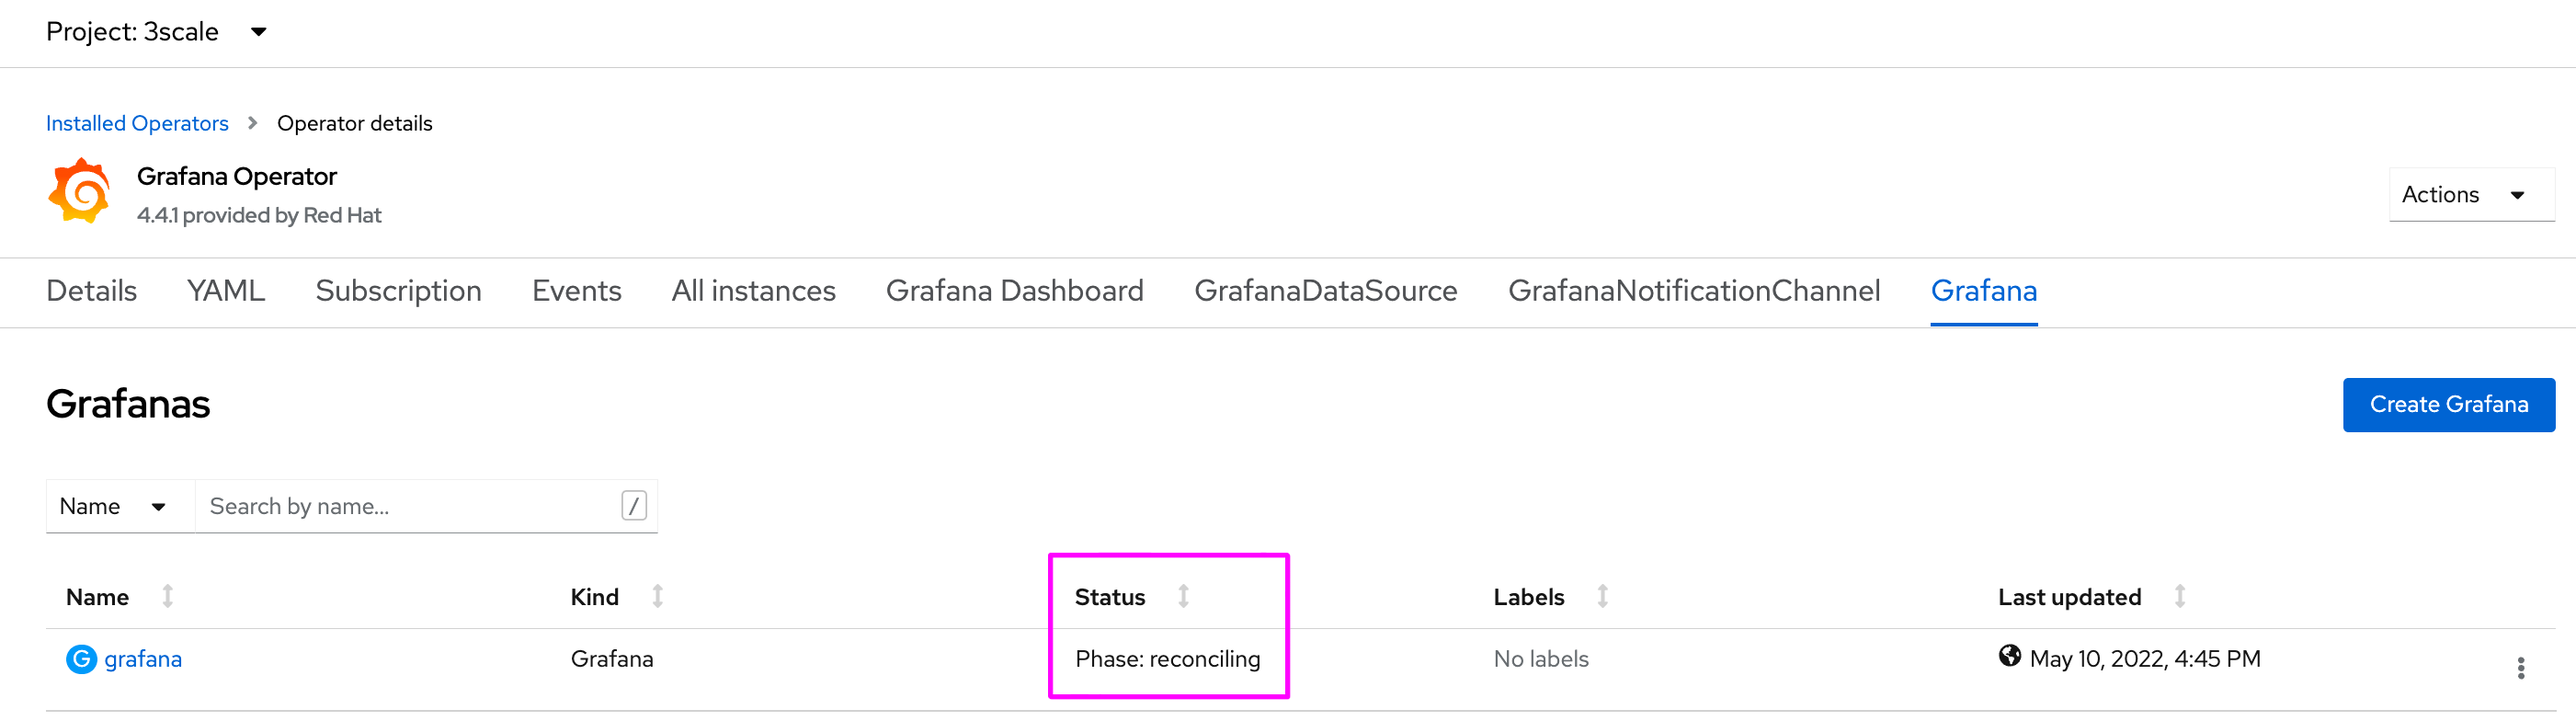
oc describe grafana apm-grafana -n $MANAGER_MONITORING_NSAfter that, you can watch for the Grafana deployment at Grafana tab in the operator:
Update Grafana service account with OpenShift roles
The Grafana service account needs cluster authorization to view objects.
oc get sa -n $MANAGER_MONITORING_NS ; oc adm policy add-cluster-role-to-user cluster-monitoring-view -z grafana-serviceaccount -n $MANAGER_MONITORING_NSCreate a new DataSource
Acquire the Grafana service account token to be used at Grafana DS custom resource:
oc serviceaccounts get-token grafana-serviceaccount -n $MANAGER_MONITORING_NS ; GRAFANA_TOKEN=$(oc serviceaccounts get-token grafana-serviceaccount -n $MANAGER_MONITORING_NS)note: you can use BASIC authentication as well, but it less secure.
Create and deploy GrafanaDataSource custom resource
cat > 3scale-grafana-ds.yaml <<EOL
apiVersion: integreatly.org/v1alpha1
kind: GrafanaDataSource
metadata:
  name: prometheus
  namespace: $MANAGER_MONITORING_NS
spec:
  datasources:
    - access: proxy
      editable: true
      isDefault: true
      jsonData:
        httpHeaderName1: Authorization
        timeInterval: 5s
        tlsSkipVerify: true
      name: Prometheus
      secureJsonData:
        httpHeaderValue1: >-
          Bearer
          $GRAFANA_TOKEN
      type: prometheus
      url: 'https://thanos-querier.openshift-monitoring.svc.cluster.local:9091'
  name: middleware
EOL
oc apply -f 3scale-grafana-ds.yaml -n $MANAGER_MONITORING_NS
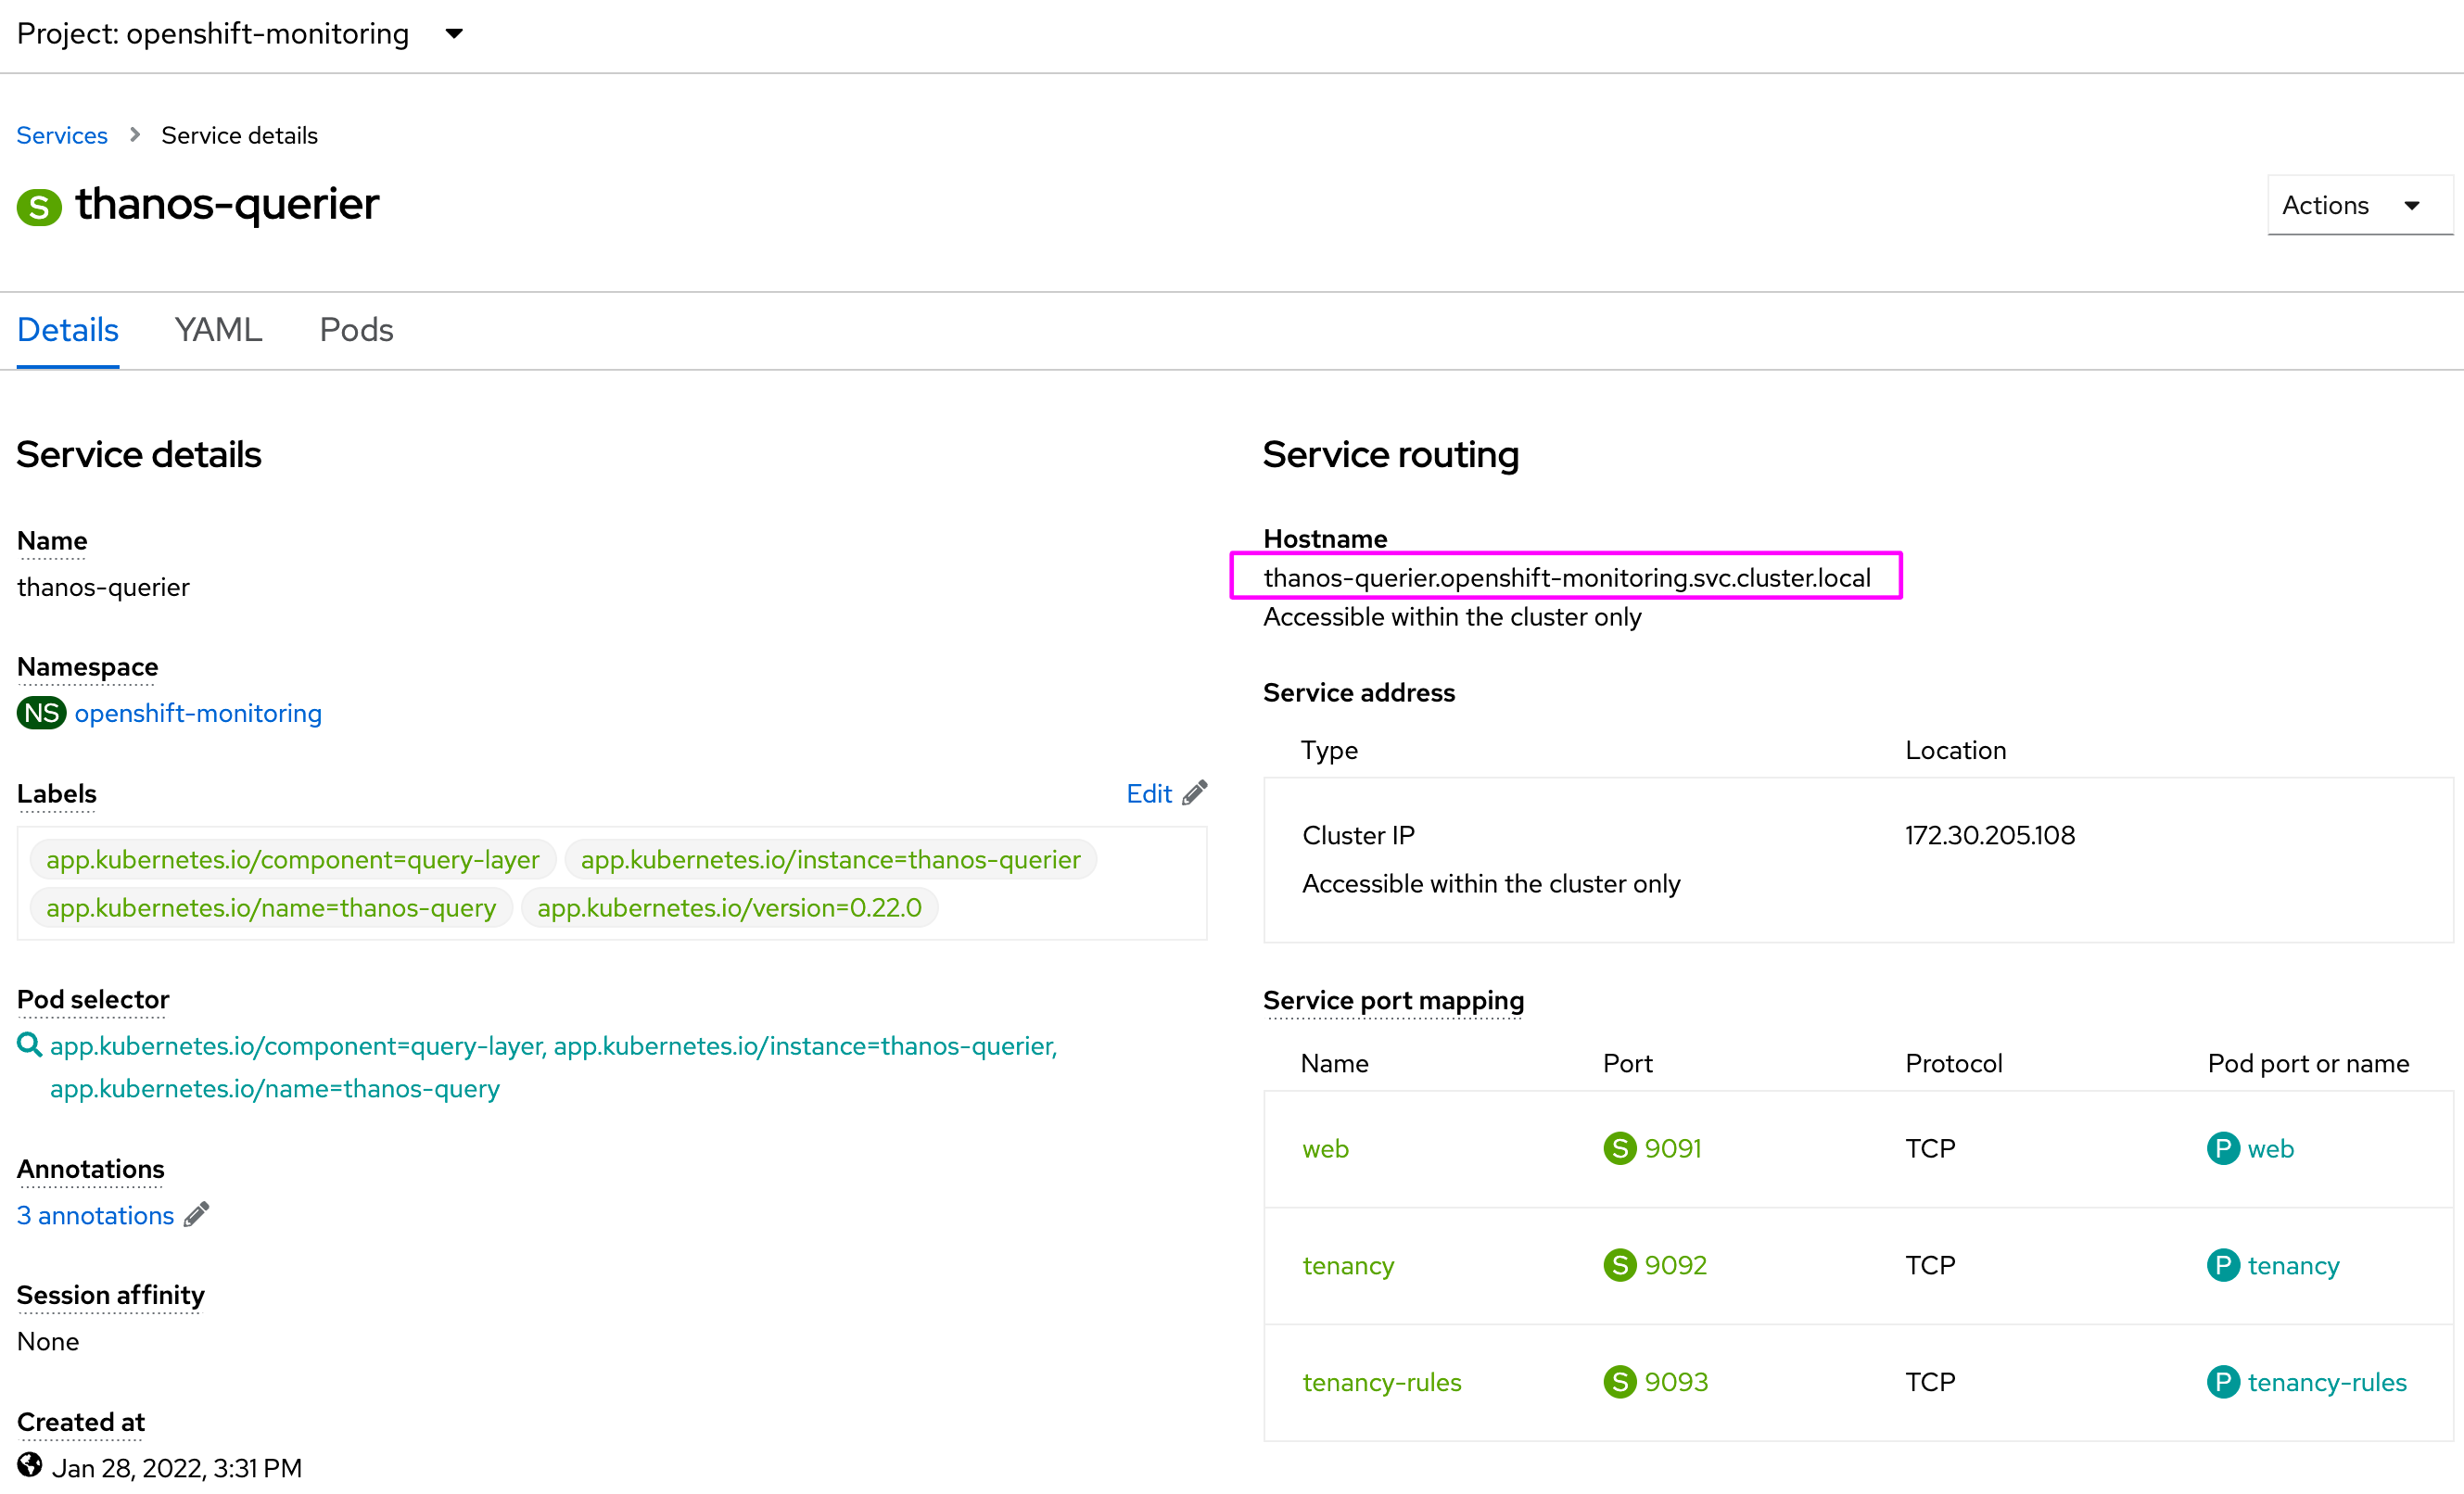
note: The url from thanos-querier should be the same for all OpenShift 4.10 clusters. It is also possible to use the external route from thanos querier if the internal one is not an option. You can acquire the external route using the following output:
echo "https://$(oc get route thanos-querier -n openshift-monitoring | awk 'NR==2 {print $2}')/api"Enable 3Scale metrics
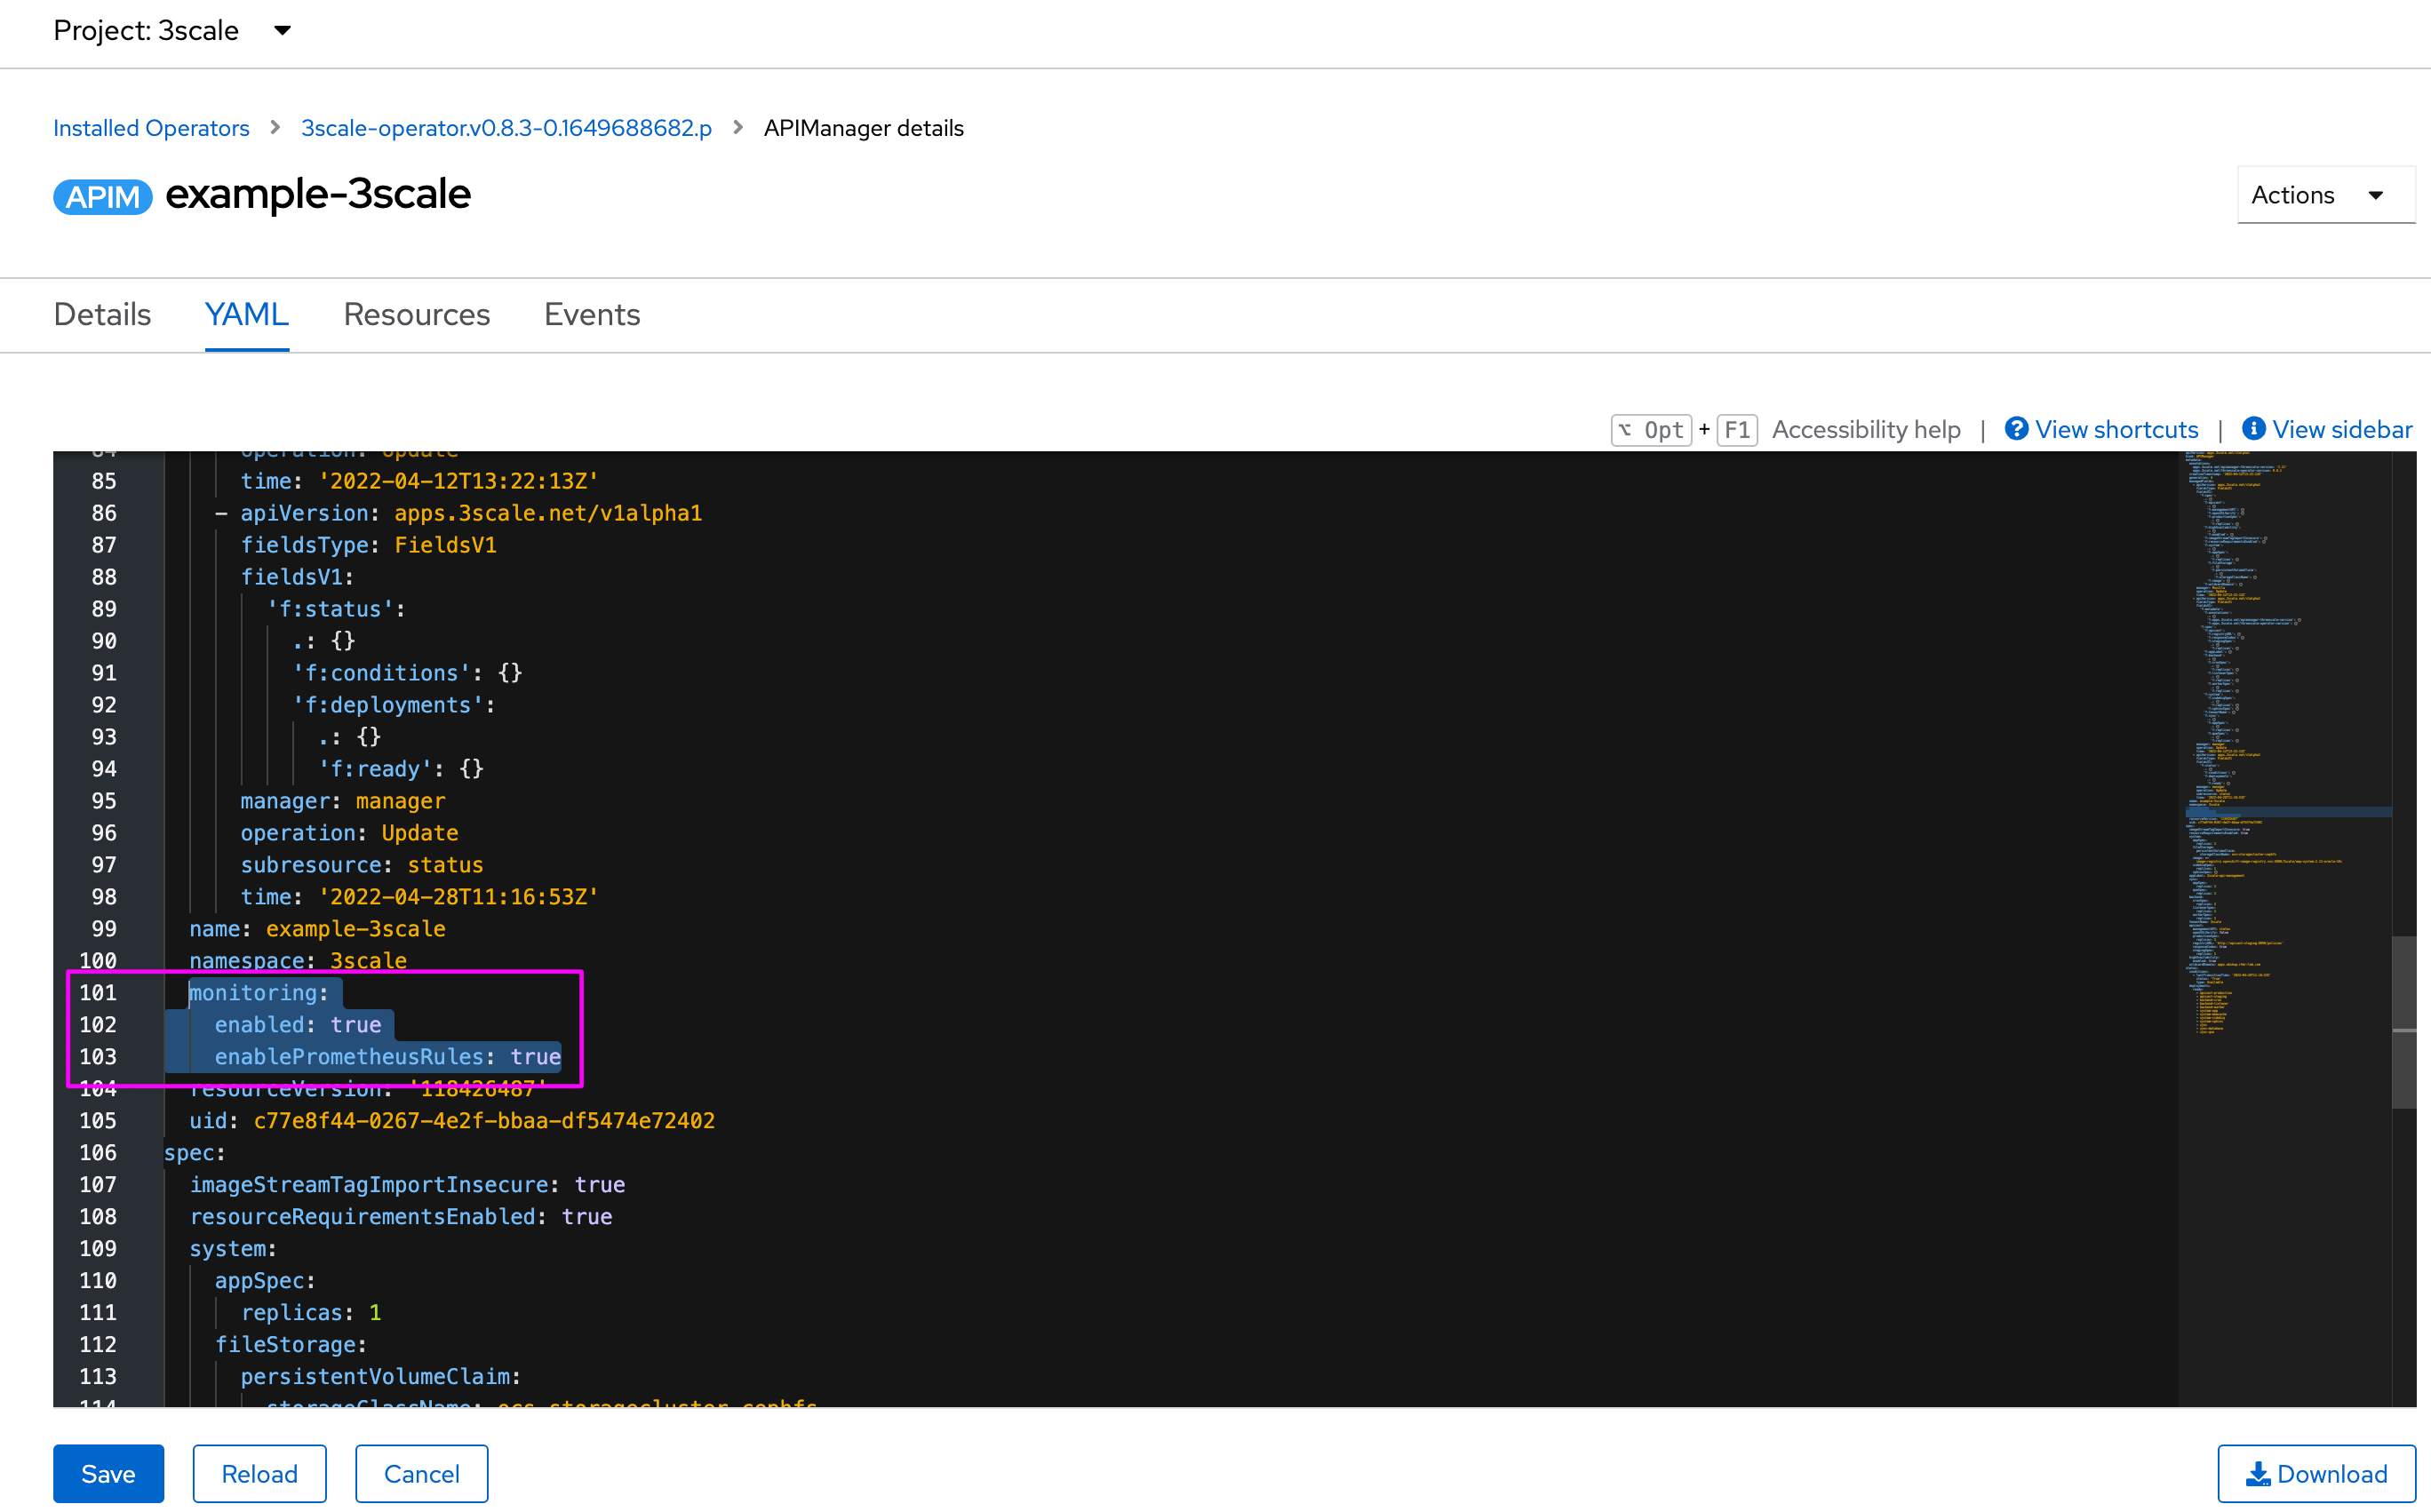
Now that we have Grafana already deployed and running, lets continue enabling 3Scale metrics. This task will flag the 3Scale operator to automatically deploy and install all provided Dashboards. The APIManager custom resource has 2 attributes:
monitoring.enabledmonitoring.enablePrometheusRules
The first will install all Grafana Dashboards, and the second will create all alerts that will be managed by Prometheus Alert Manager application. As we will not be using the 3Scale namespace for monitoring all Dashboards, we need to re-import them to $MANAGER_MONITORING_NS.
oc get servicemonitor -n $MANAGER_NS ; cat > 3scale-monitoring.yaml <<EOL
apiVersion: apps.3scale.net/v1alpha1
kind: APIManager
metadata:
  name: $MANAGER_NAME
spec:
  wildcardDomain: apps.$WILDCARD_DOMAIN
  monitoring:
    enabled: true
    enablePrometheusRules: true
EOL
oc apply -f 3scale-monitoring.yaml -n $MANAGER_NS ; watch -n1 oc get GrafanaDashboard -n $MANAGER_NS
You should see all created resources in the terminal.
Import Grafana Dashboards to a custom monitoring namespace
As we will use another namespace for monitoring resources, we will need to get the Dashboards from $MANAGER_NS and create them into $MANAGER_MONITORING_NS:
export GRAFANA_DASHBOARDS=($(oc get GrafanaDashboard -n $MANAGER_NS | awk 'NR>1 {print $1}' | sed ':a; N; $!ba; s/\n/,/g' | tr ',' '\n'));
echo "Importing 3Scale Grafana Dashboards. This operation could take a while. \n-----------------------------------------------------------------------"; \
for x in "${GRAFANA_DASHBOARDS[@]}"; do \
oc get GrafanaDashboard $x -n $MANAGER_NS -o yaml | sed 's/namespace: '"$MANAGER_NS"'/namespace: '"$MANAGER_MONITORING_NS"'/g' > ${x}_to-import.yaml; \
sed -i '/ generation:/d' ${x}_to-import.yaml; \
sed -i '/ resourceVersion:/d' ${x}_to-import.yaml; \
sed -i '/ uid:/d' ${x}_to-import.yaml; \
sed -i '/ creationTimestamp:/d' ${x}_to-import.yaml; \
sed -i '/^ ownerReferences:/{N;N;N;N;N;d}' ${x}_to-import.yaml; \
oc delete GrafanaDashboard $x -n $MANAGER_MONITORING_NS; \
sleep 1; \
oc create -f ${x}_to-import.yaml; \
rm -fr ${x}_to-import.yaml; \
echo "$x GrafanaDashboard successfully imported! \n"; \
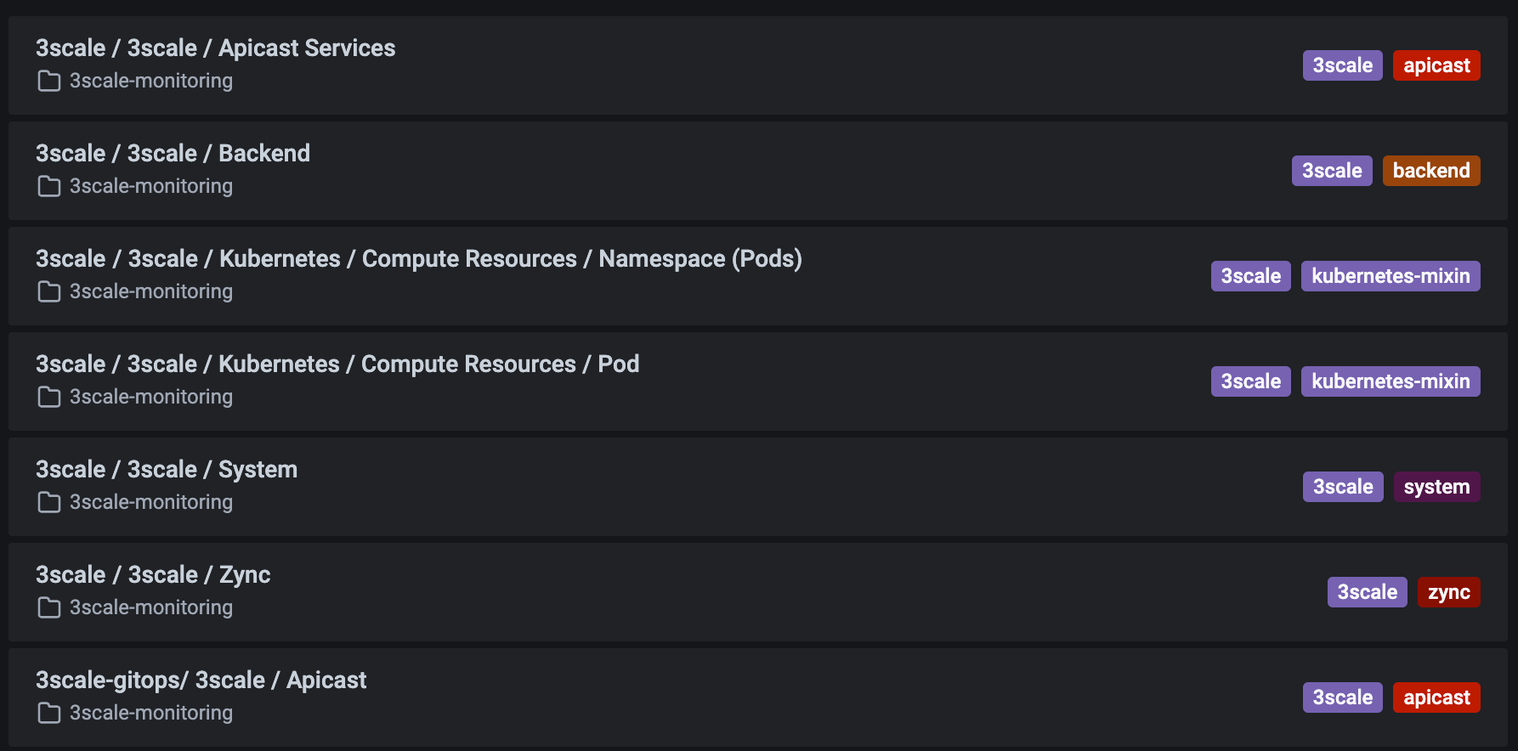
doneNow, all Dashboards are properly configured into the right namespace:
oc get GrafanaDashboard -n $MANAGER_MONITORING_NSOpen Grafana console
Acquire Grafana route:
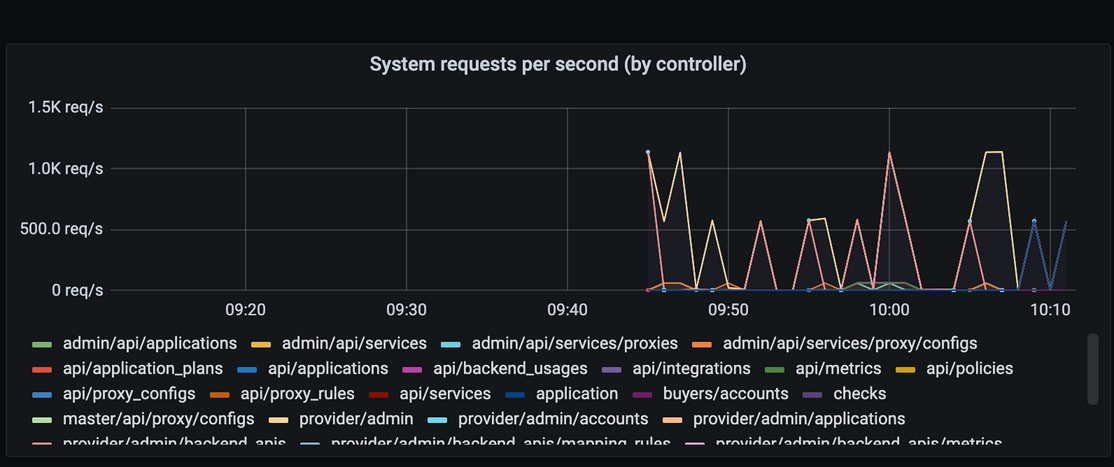
GRAFANA_URL=$(oc get routes -n $MANAGER_MONITORING_NS | grep grafana | awk '{print $2}') ; echo '\nhttps://'$GRAFANA_URL'\n'Then, go over Manager menu item and check all dashboards:
note: To monitor external APICasts instances as defined in $APICAST_NSS, you’ll need to manually add those namespaces in GrafanaDashboards Custom Resources as 3Scale only monitors the standard APICast instances. You should find those entries and change them from:
..
"options": [{
  "selected": true,
  "text": "3scale",
  "value": "3scale"
}]
..
to something like:
..
"options": [{
  "selected": true,
  "text": "3scale",
  "value": "3scale"
},{
  "selected": false,
  "text": "",
  "value": "3scale-apicast-intranet"
},{
  "selected": false,
  "text": "",
  "value": "3scale-apicast-internet"
},{
  "selected": false,
  "text": "",
  "value": "3scale-apicast-mobile"
}]
..
This affects apicast-mainapp and apicast-services Dashboards.
Now, Grafana can be used to monitor all provided metrics:
Also note that It is ok to have reconciling status at Grafana operator:
Working with Prometheus Alert-Manager
Navigating through Developer view at OpenShift, it is possible to see all custom 3Scale alerts that was created:
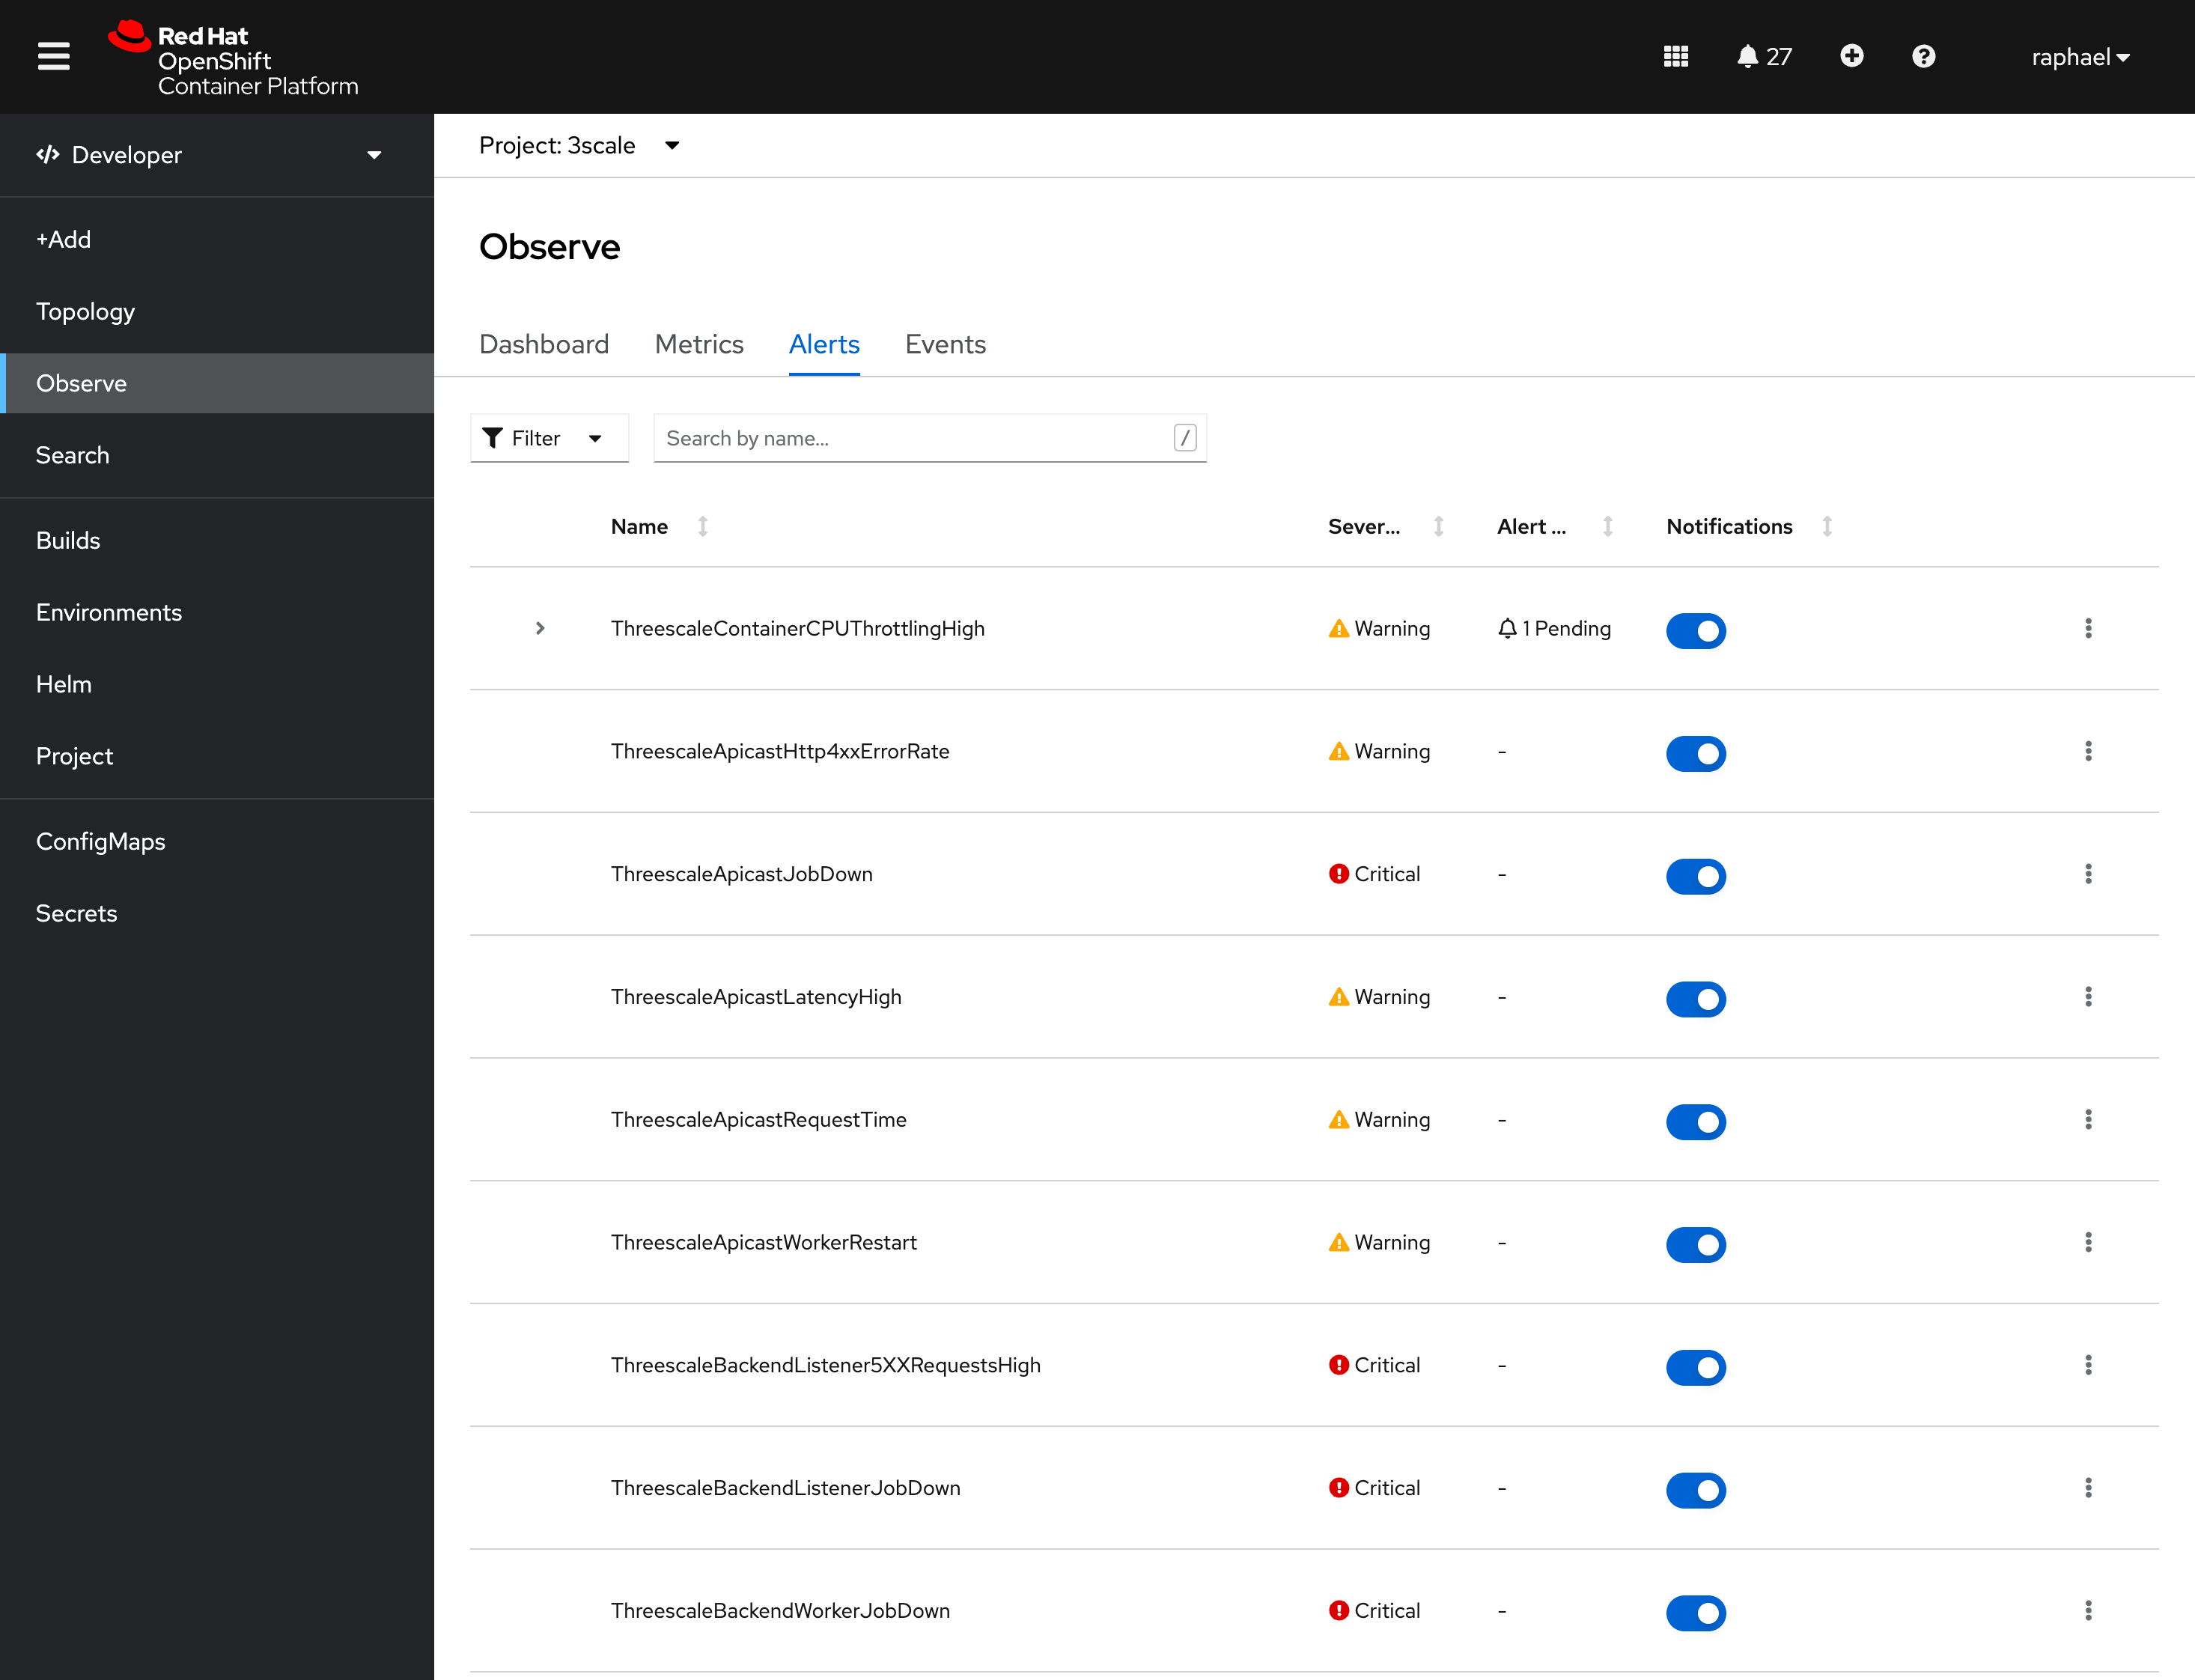
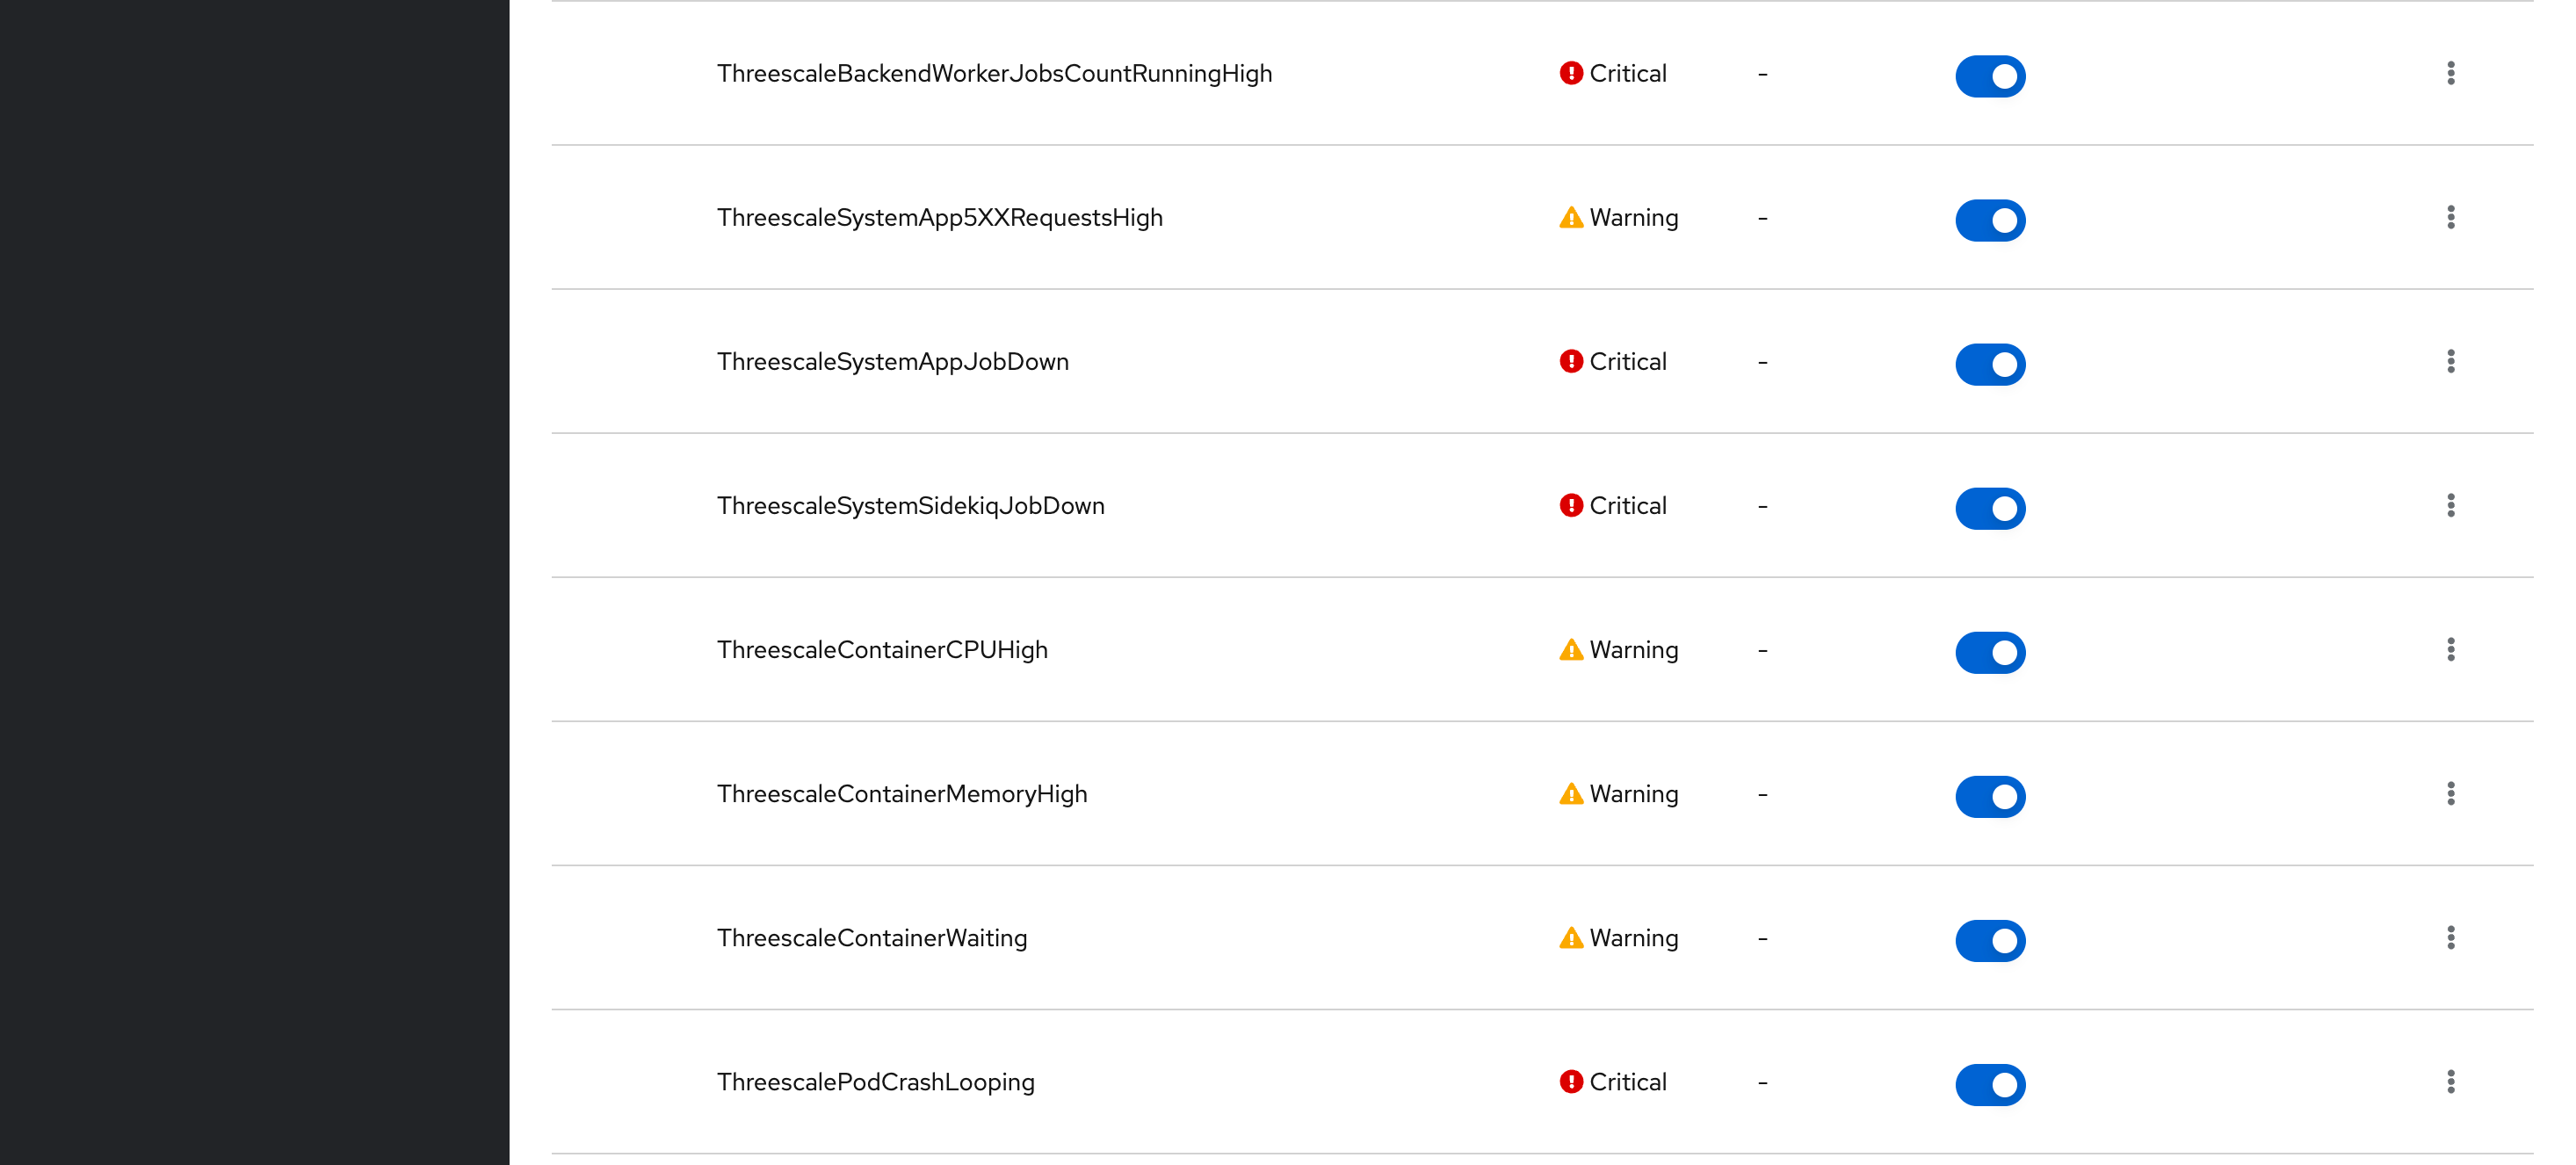
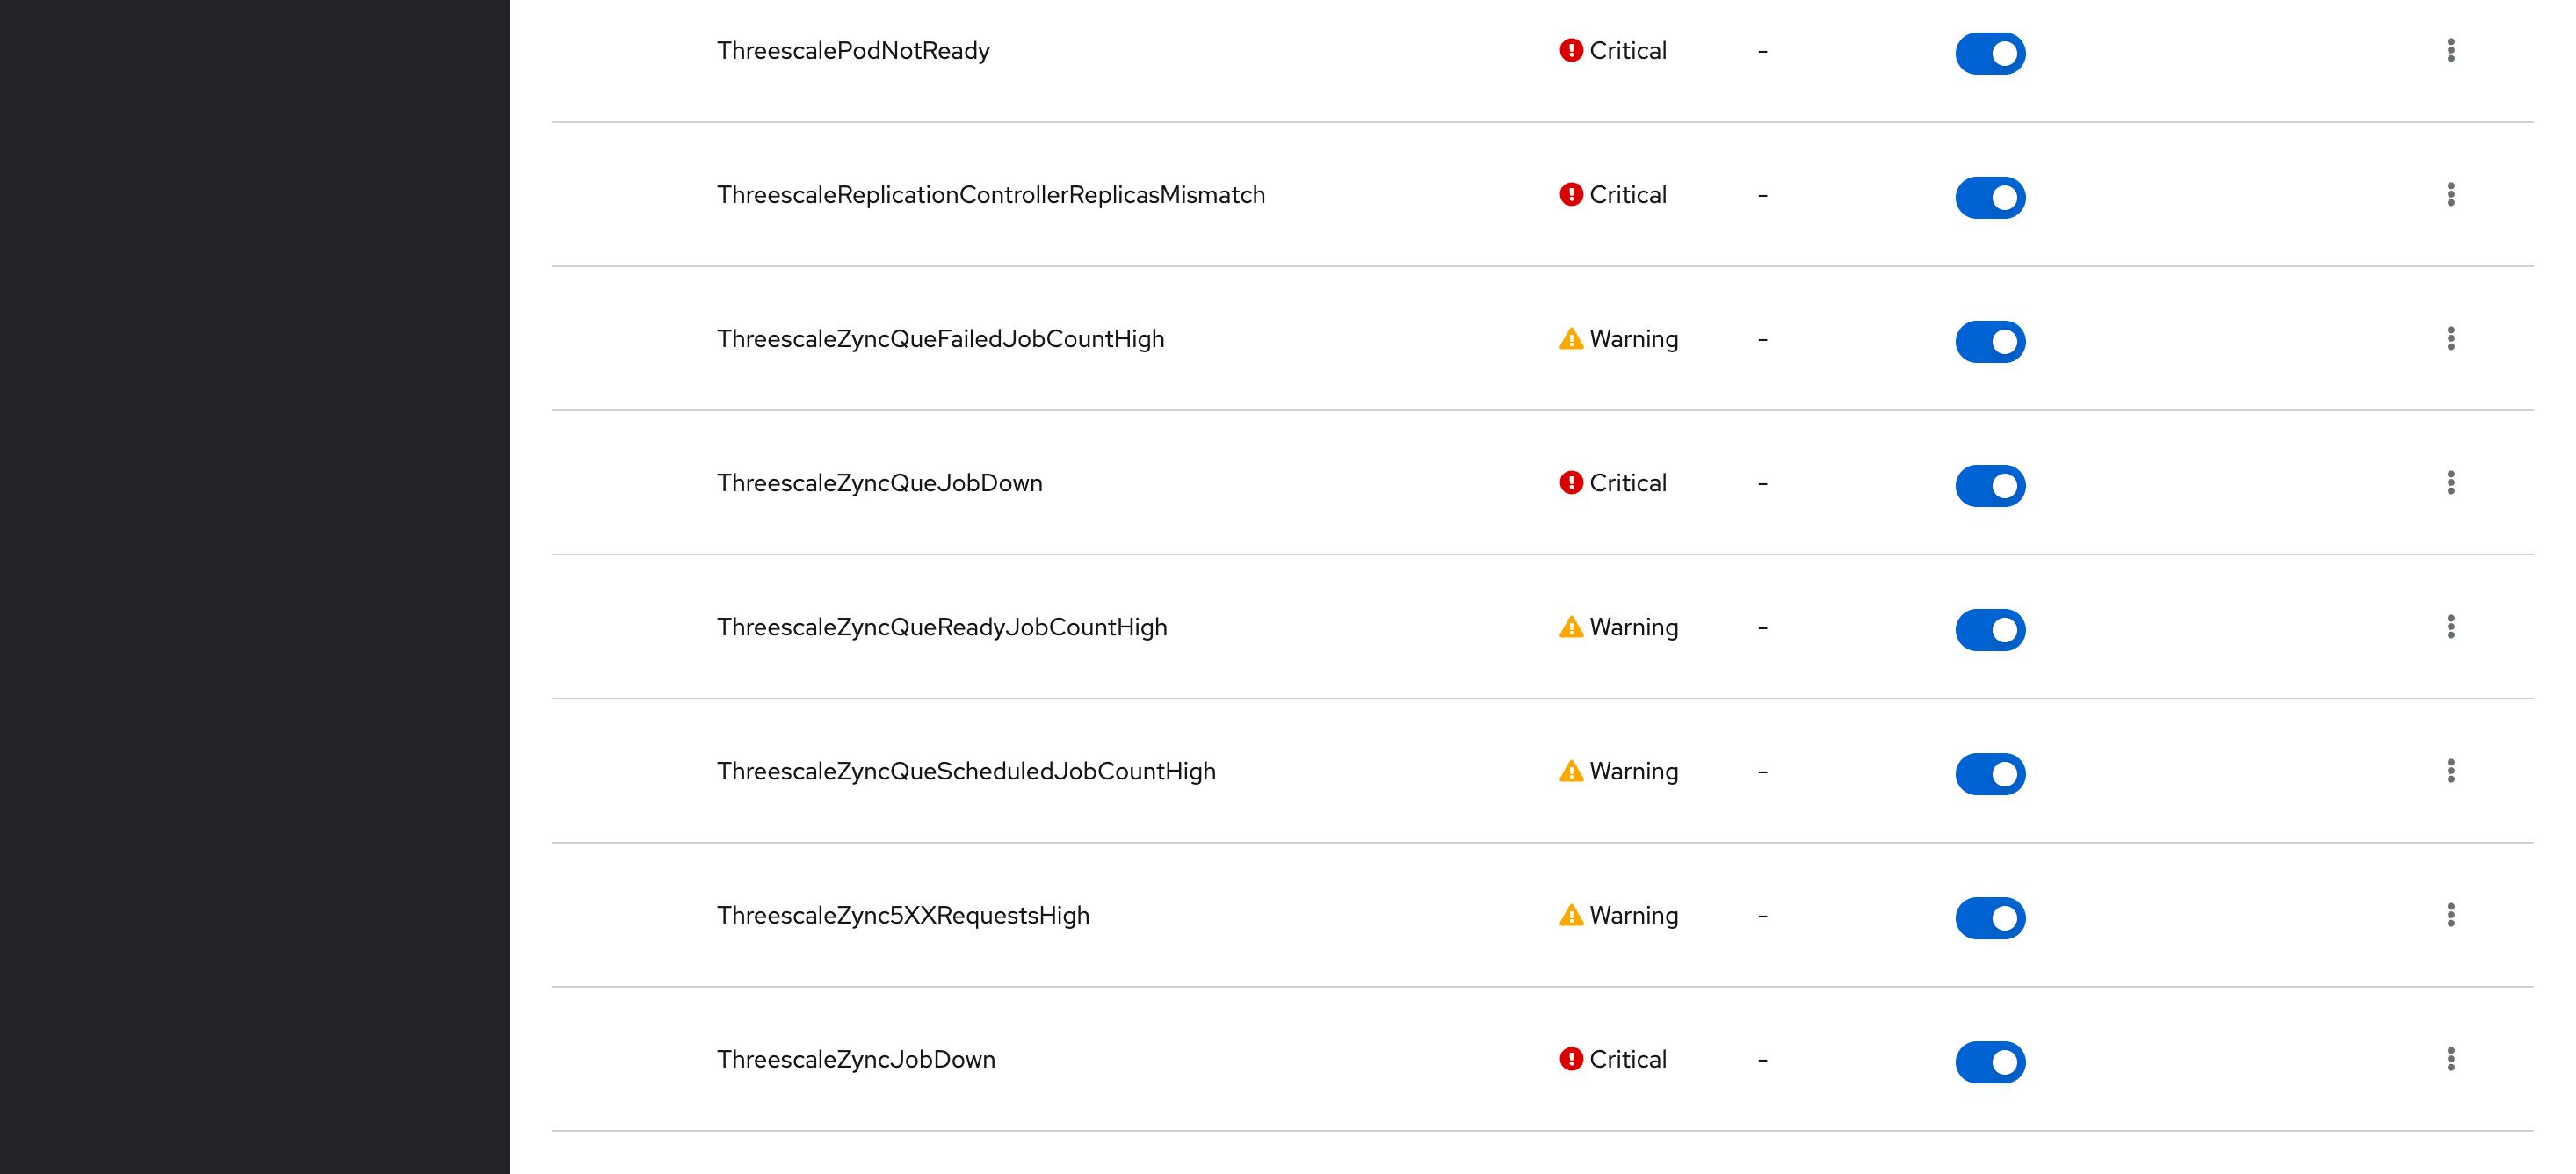
These alerts are managed by 3Scale operator (threescale-operator-controller-manager-v2). These alerts could also change over time with future 3Scale releases.
If you can’t see those alerts at OpenShift, you’ll need to force 3Scale operator to re-deploy them, applying false and then true again for monitoring.enablePrometheusRules attribute at APIManager CR:
Execute this first:
oc get servicemonitor -n $MANAGER_NS ; cat > 3scale-monitoring.yaml <<EOL
apiVersion: apps.3scale.net/v1alpha1
kind: APIManager
metadata:
  name: $MANAGER_NAME
spec:
  wildcardDomain: apps.$WILDCARD_DOMAIN
  monitoring:
    enabled: true
    enablePrometheusRules: false
EOL
oc apply -f 3scale-monitoring.yaml -n $MANAGER_NS
and then:
oc get servicemonitor -n $MANAGER_NS ; cat > 3scale-monitoring.yaml <<EOL
apiVersion: apps.3scale.net/v1alpha1
kind: APIManager
metadata:
  name: $MANAGER_NAME
spec:
  wildcardDomain: apps.$WILDCARD_DOMAIN
  monitoring:
    enabled: true
    enablePrometheusRules: true
EOL
oc apply -f 3scale-monitoring.yaml -n $MANAGER_NS
Send alerts to a destination
With Alert Manager it is possible to configure receivers with specific routing labels with alerting priorities to be sent to a destination. You can configure WARNING alert types to be sent to an email account and CRITICAL alerts to be sent to an Slack account for example.
To configure a email receiver using Gmail from Google,export the following variables:
export SMTP_HOST="smtp.gmail.com:587"
export SMTP_MAIL_FROM="changeme@gmail.com"
export SMTP_MAIL_USER="changeme@gmail.com"
# set a gmail app password here
export SMTP_MAIL_PASS="changeme"
PS. remember to replace with your own gmail/smtp account accordingly. You can create a gmail app password here.
First create a backup of your current alertmanager-main secret:
oc get secret alertmanager-main -n openshift-monitoring -o yaml > alertmanager-main.backup.yamlThen, execute the following to configure the SMTP integration:
oc get secret alertmanager-main -n openshift-monitoring -o go-template='{{index .data "alertmanager.yaml"}}' | base64 -d > config.out

sed -i '/^\"global\"\:/a \  "smtp_require_tls": true' config.out ; cat config.out
sed -i '/^\"global\"\:/a \  "smtp_smarthost": "'$SMTP_HOST'"' config.out ; cat config.out
sed -i '/^\"global\"\:/a \  "smtp_hello": HOSTNAME' config.out ; cat config.out
sed -i '/^\"global\"\:/a \  "smtp_from": "'$SMTP_MAIL_FROM'"' config.out ; cat config.out
sed -i '/^\"global\"\:/a \  "smtp_auth_username": "'$SMTP_MAIL_FROM'"' config.out ; cat config.out
sed -i '/^\"global\"\:/a \  "smtp_auth_identity": "'$SMTP_MAIL_FROM'"' config.out ; cat config.out
sed -i '/^\"global\"\:/a \  "smtp_auth_password": "'$SMTP_MAIL_PASS'"' config.out ; cat config.out
sed -i '/^\"global\"\:/a \  "smtp_auth_secret": "'$SMTP_MAIL_PASS'"' config.out ; cat config.out

export ALERTMANAGER_CONFIG=$(cat config.out | base64) ; export ALERTMANAGER_CONFIG=$(echo "${ALERTMANAGER_CONFIG//[$'\t\r\n ']}") ; echo $ALERTMANAGER_CONFIG

oc delete secret alertmanager-main -n openshift-monitoring ; cat > alertmanager-main.yaml <<EOL
apiVersion: v1
data:
  alertmanager.yaml: $ALERTMANAGER_CONFIG
kind: Secret
metadata:
  labels:
    app.kubernetes.io/component: alert-router
    app.kubernetes.io/instance: main
    app.kubernetes.io/name: alertmanager
    app.kubernetes.io/part-of: openshift-monitoring
  name: alertmanager-main
  namespace: openshift-monitoring
type: Opaque
EOL
oc create -f alertmanager-main.yaml -n openshift-monitoring
Then, force the reload of configurations:
oc delete po -l alertmanager=main -n openshift-monitoringcheck if configuration was loaded successfully:
oc logs alertmanager-main-0 -c alertmanager -f -n openshift-monitoringIt should print something like:
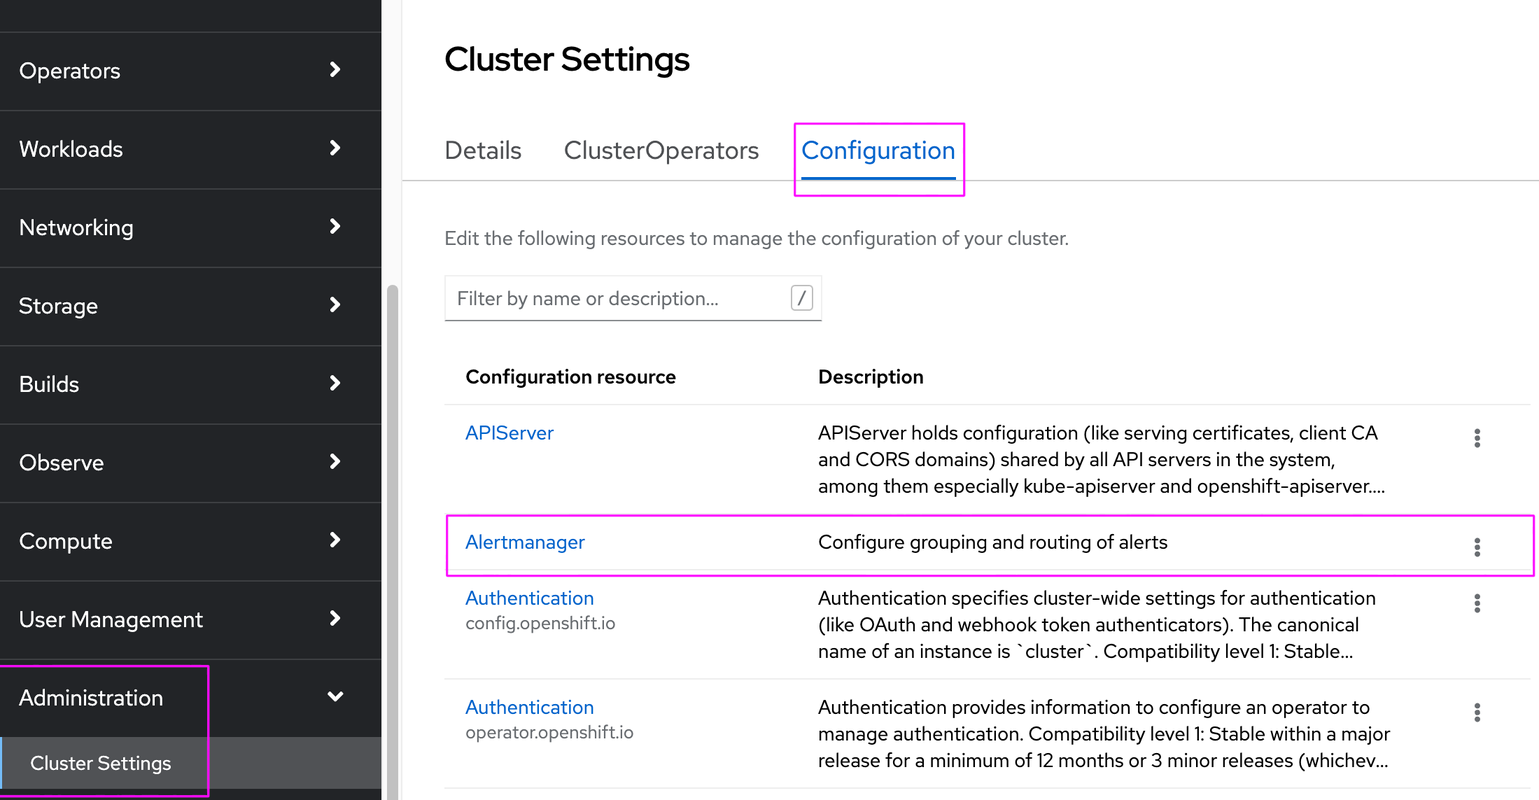
>>> > level=info .. component=configuration msg="Completed loading of configuration file" file=/etc/alertmanager/config/alertmanager.yamlAt OpenShift you can create a new Email receiver using the previously defined configuration.
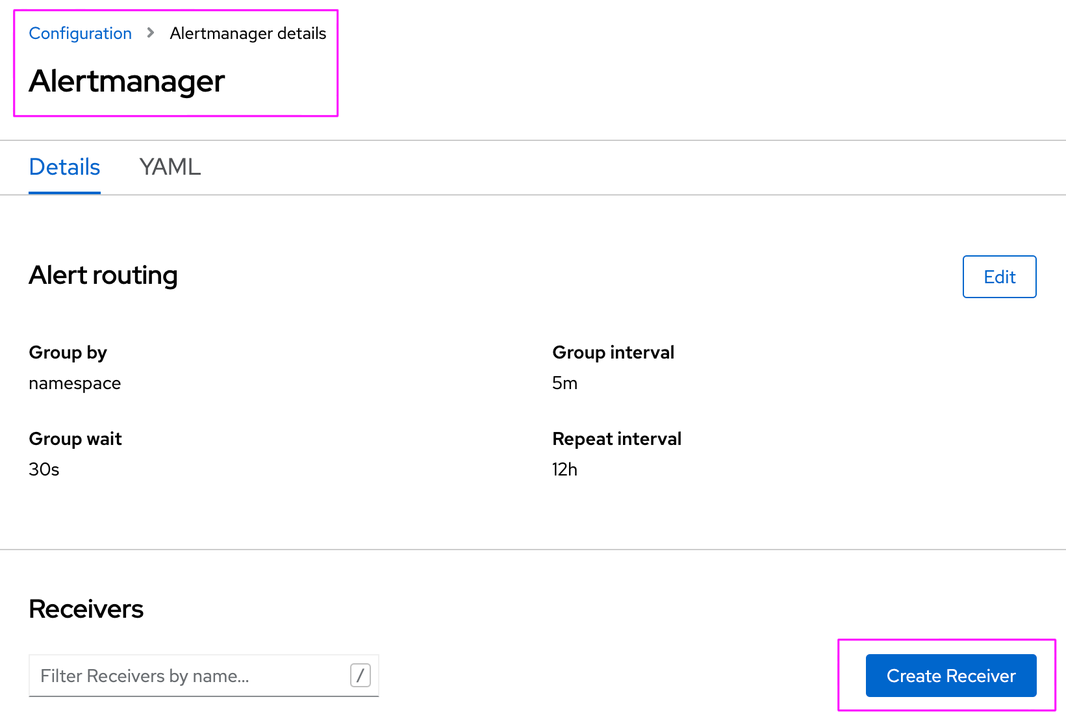
Then, select receiver type:
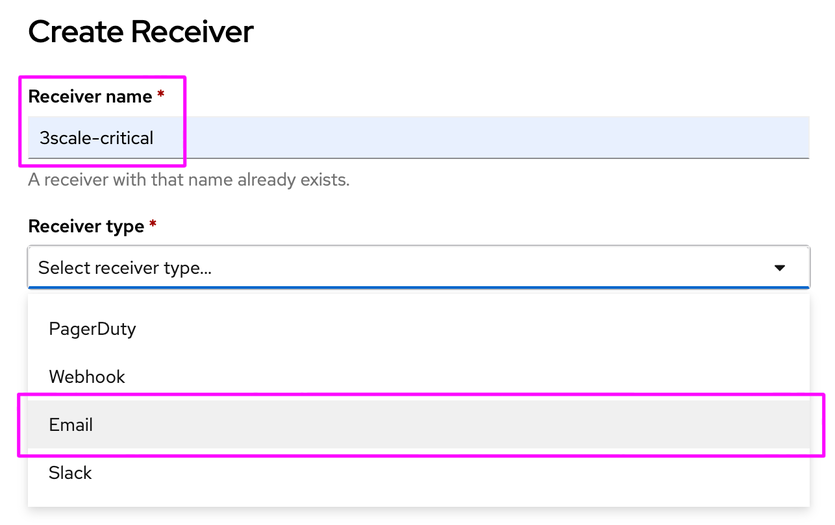
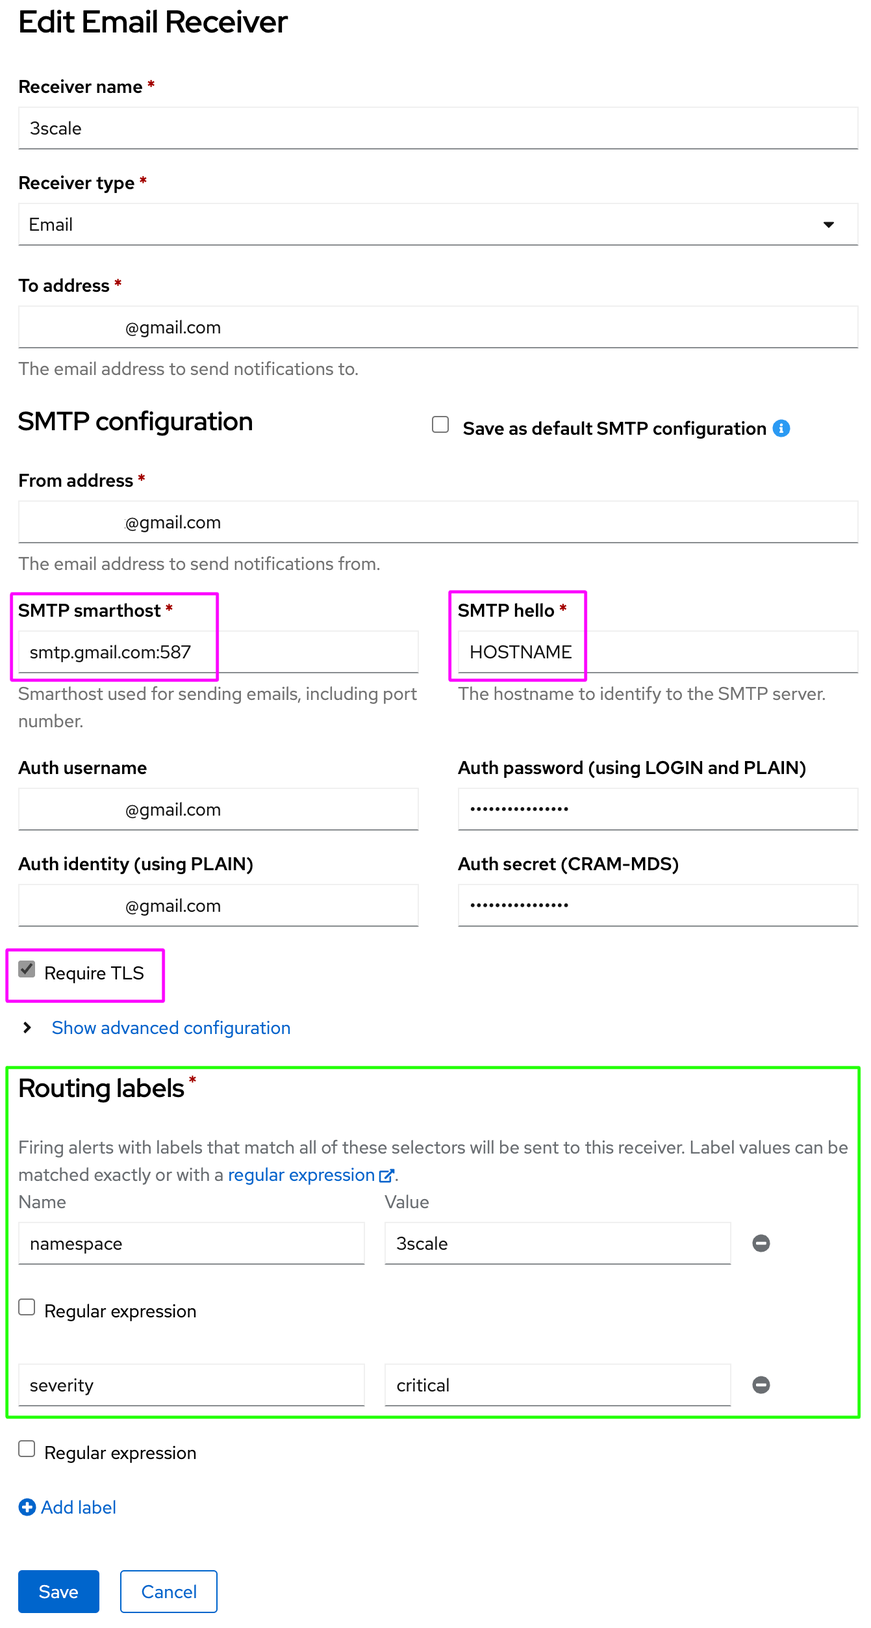
note: You can use alertname, namespace, pod and severity routing labels.
This is the final configuration of alertmanager-main secret that I’ve got as a valid example, working with the Default and 3scale-critical receivers:
global:
  smtp_auth_secret: *****
  smtp_auth_password: *****
  smtp_auth_identity: *****@gmail.com
  smtp_auth_username: *****@gmail.com
  smtp_from: *****@gmail.com
  smtp_hello: HOSTNAME
  smtp_smarthost: 'smtp.gmail.com:587'
  smtp_require_tls: true
  resolve_timeout: 5m
inhibit_rules:
  - equal:
      - namespace
      - alertname
    source_matchers:
      - severity = critical
    target_matchers:
      - severity =~ warning|info
  - equal:
      - namespace
      - alertname
    source_matchers:
      - severity = warning
    target_matchers:
      - severity = info
receivers:
  - name: 3scale-critical
    email_configs:
      - to: *****@gmail.com
        html: '3scale-critical receiver <br> {{ template "email.default.html" . }}'
  - name: Default
    email_configs:
      - to: *****@gmail.com
        html: 'openshift-default receiver <br> {{ template "email.default.html" . }}'
  - name: Watchdog
route:
  group_by:
    - namespace
  group_interval: 5m
  group_wait: 30s
  receiver: Default
  repeat_interval: 12h
  routes:
    - matchers:
        - alertname = Watchdog
      receiver: Watchdog
    - receiver: 3scale-critical
      match:
        namespace: 3scale
        severity: critical
Chaos testing 3Scale
Lets unplug things to test 3Scale alerts! (PrometheusRule Custom Resource).
In this example, I chose to shutdown 3Scale operator to simulate a crash at backend-redis and zync-que components:
oc scale deployment threescale-operator-controller-manager-v2 --replicas=0 -n $MANAGER_NS
oc scale deploymentconfig backend-redis --replicas=0 -n $MANAGER_NS
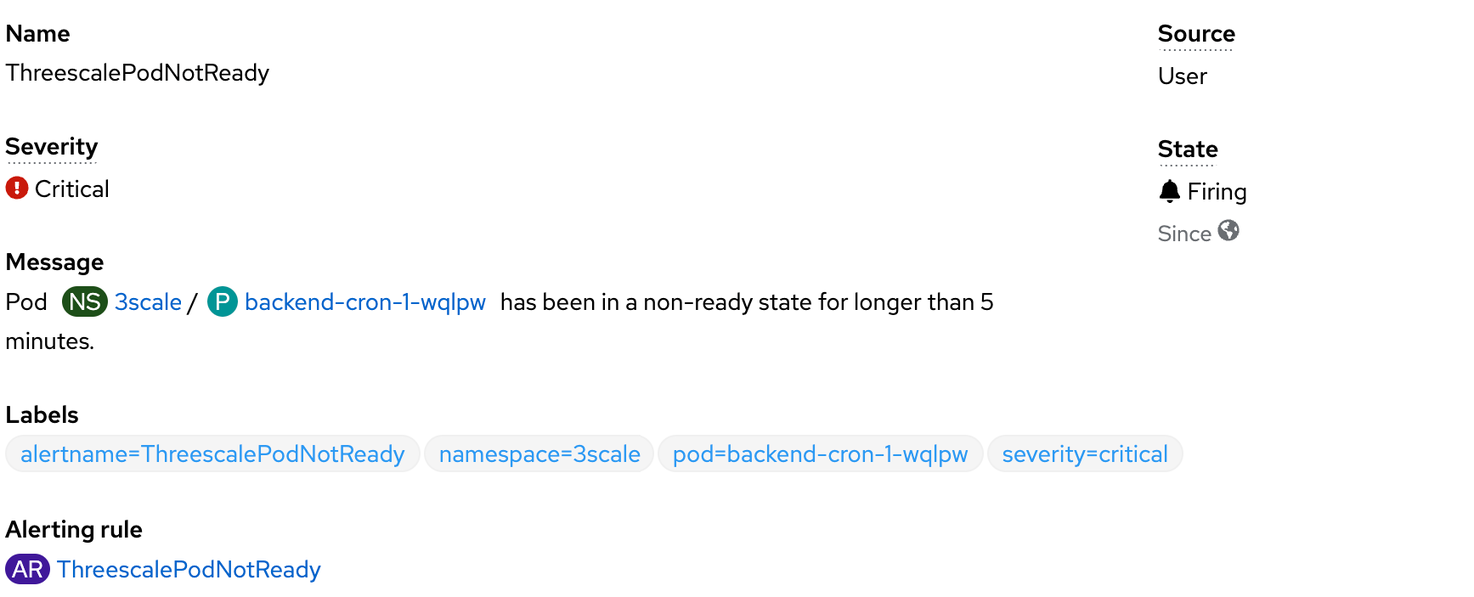
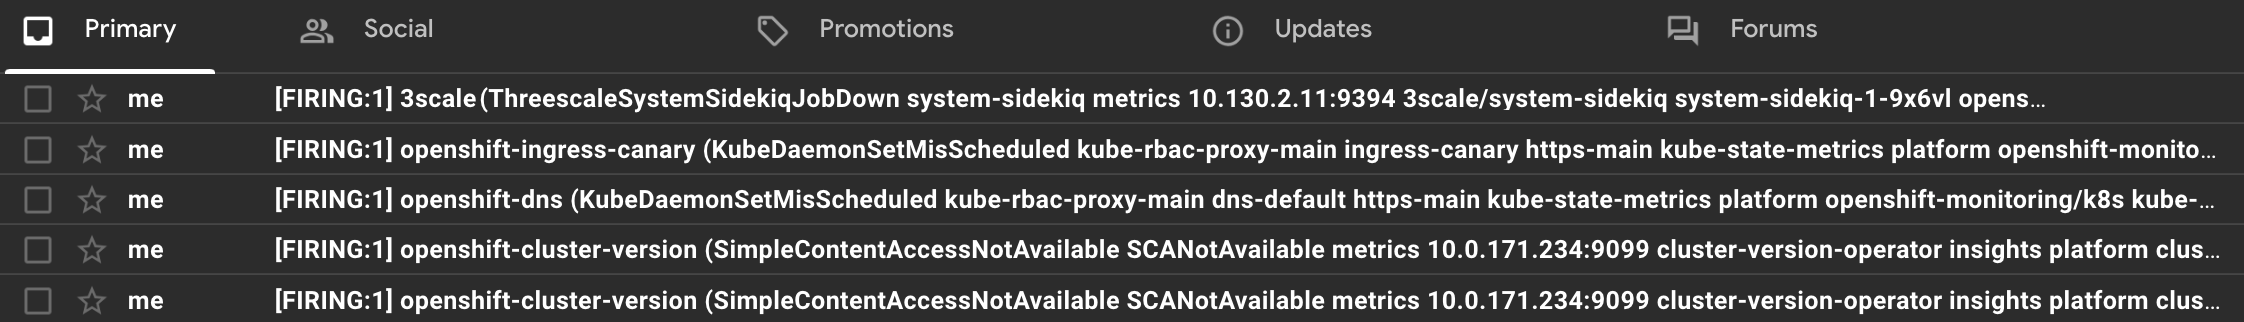
oc scale deploymentconfig zync-que --replicas=0 -n $MANAGER_NSThen, after a few seconds, backend-worker POD will start to show CrashLoopBackOfferrors, and at Observe tab in Developer view, you should see the following alerts being fired:
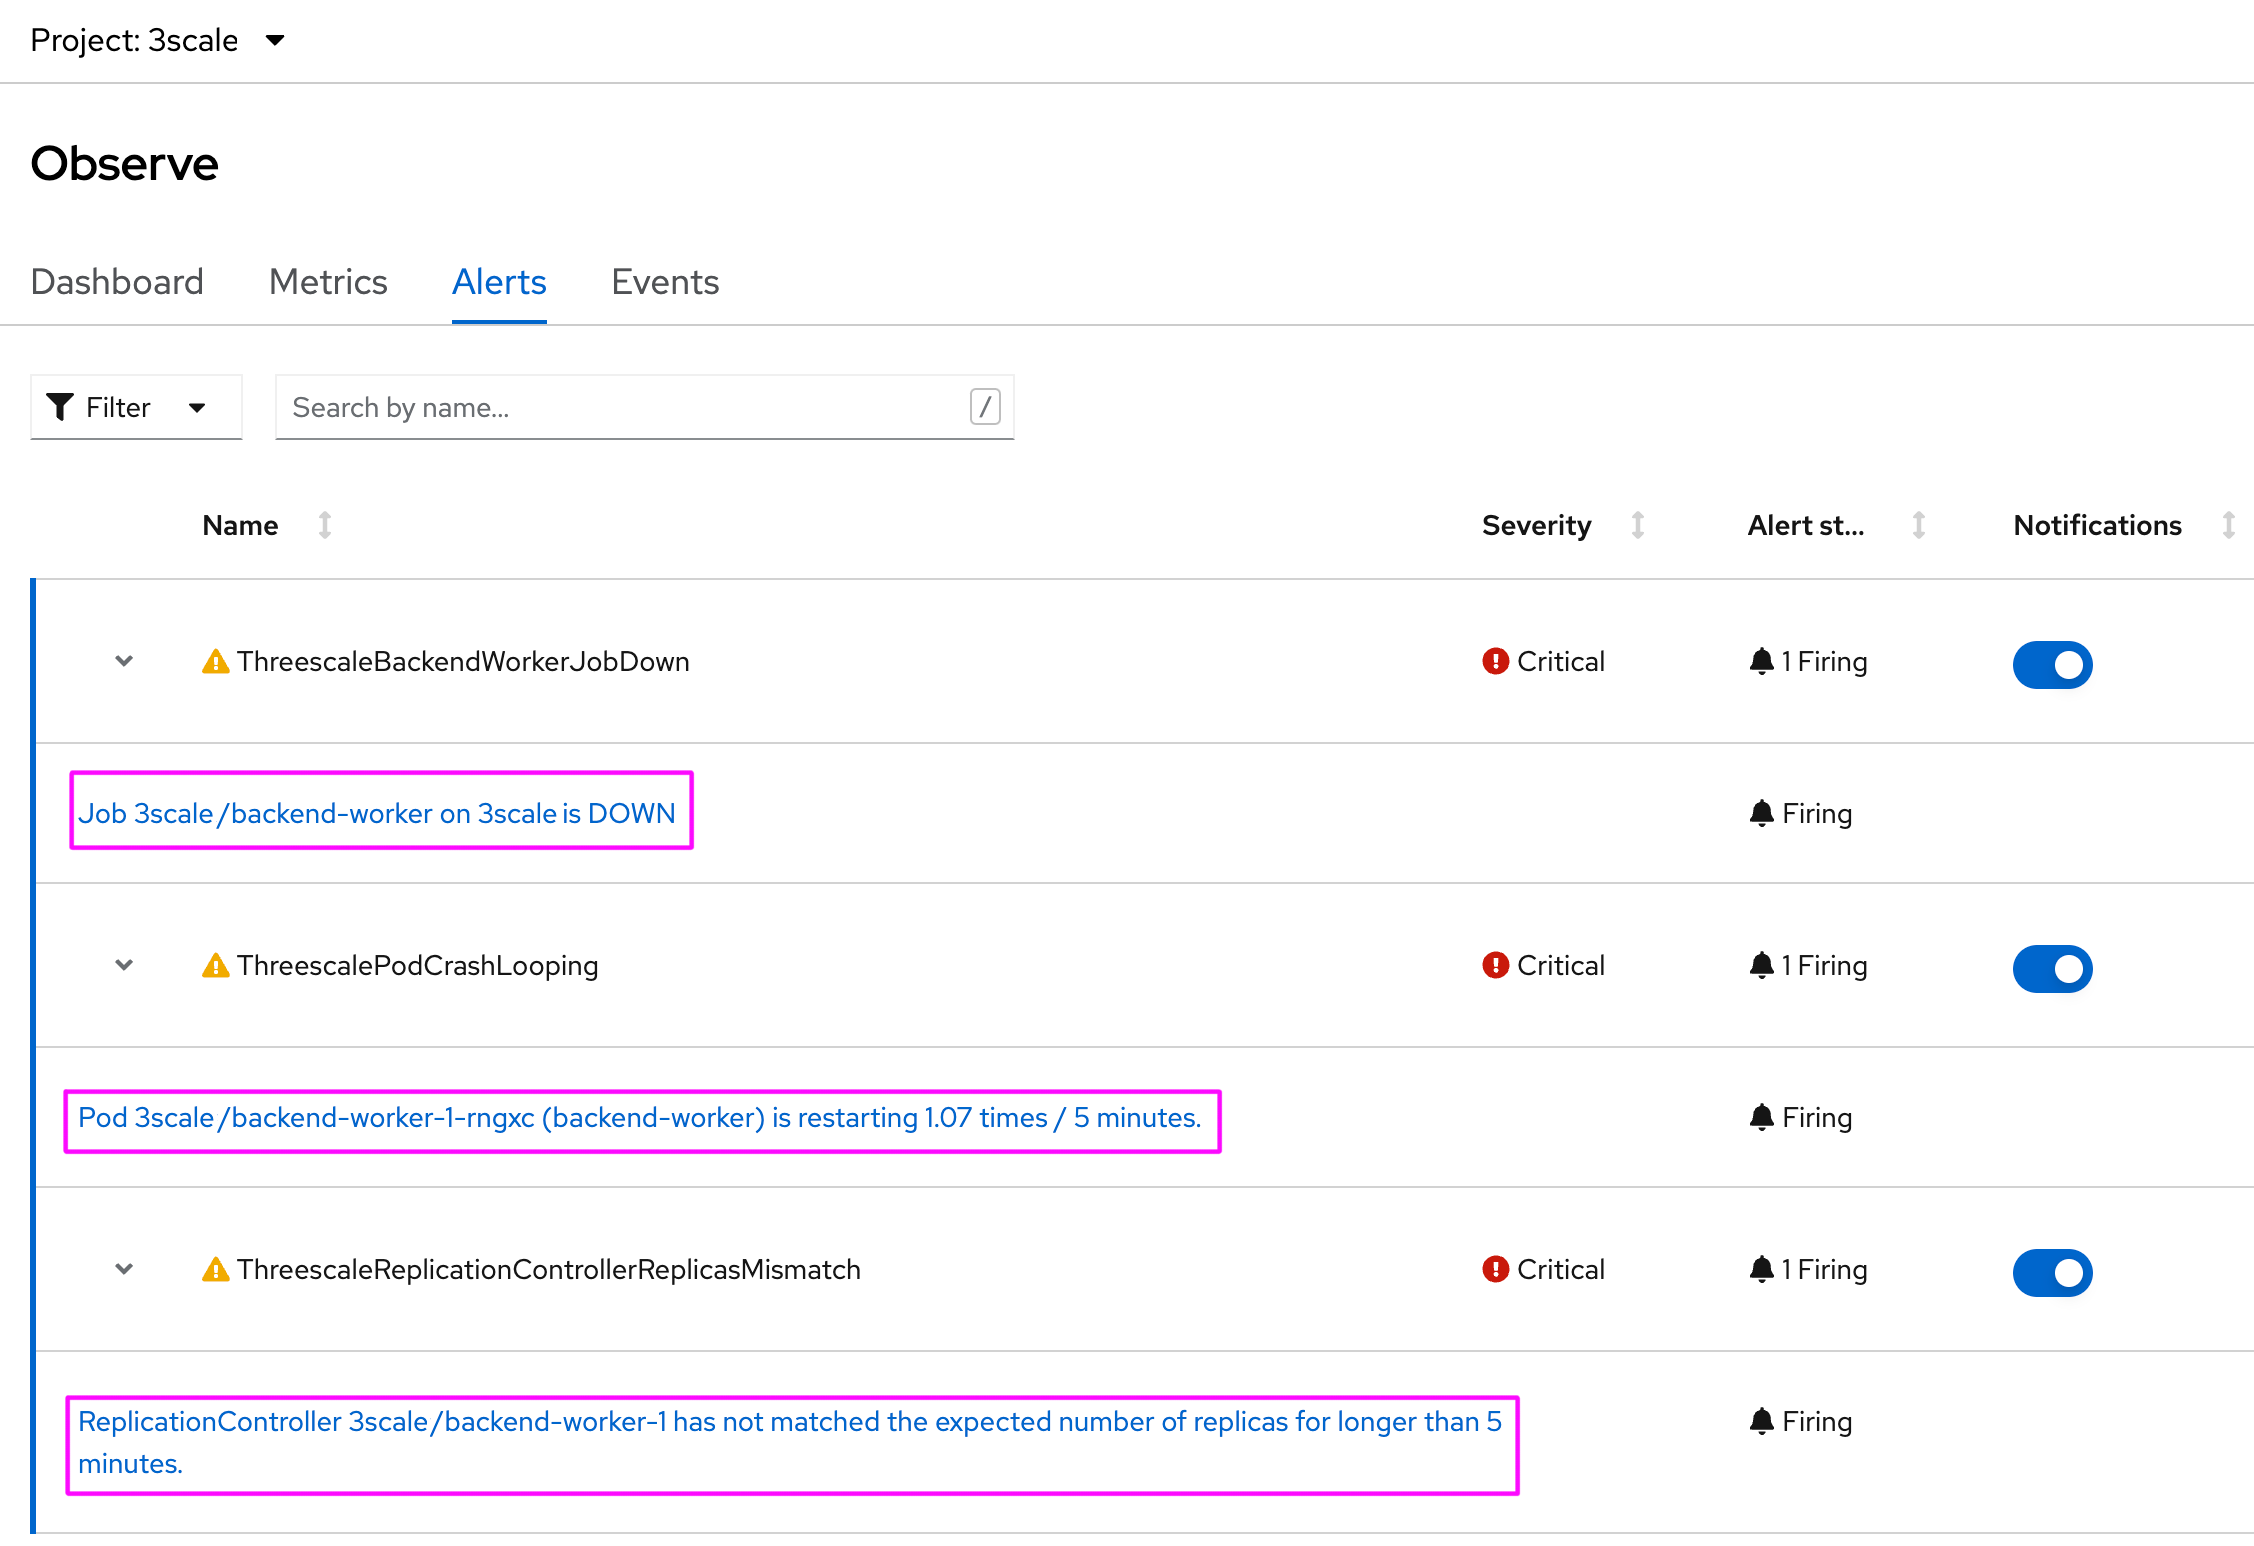
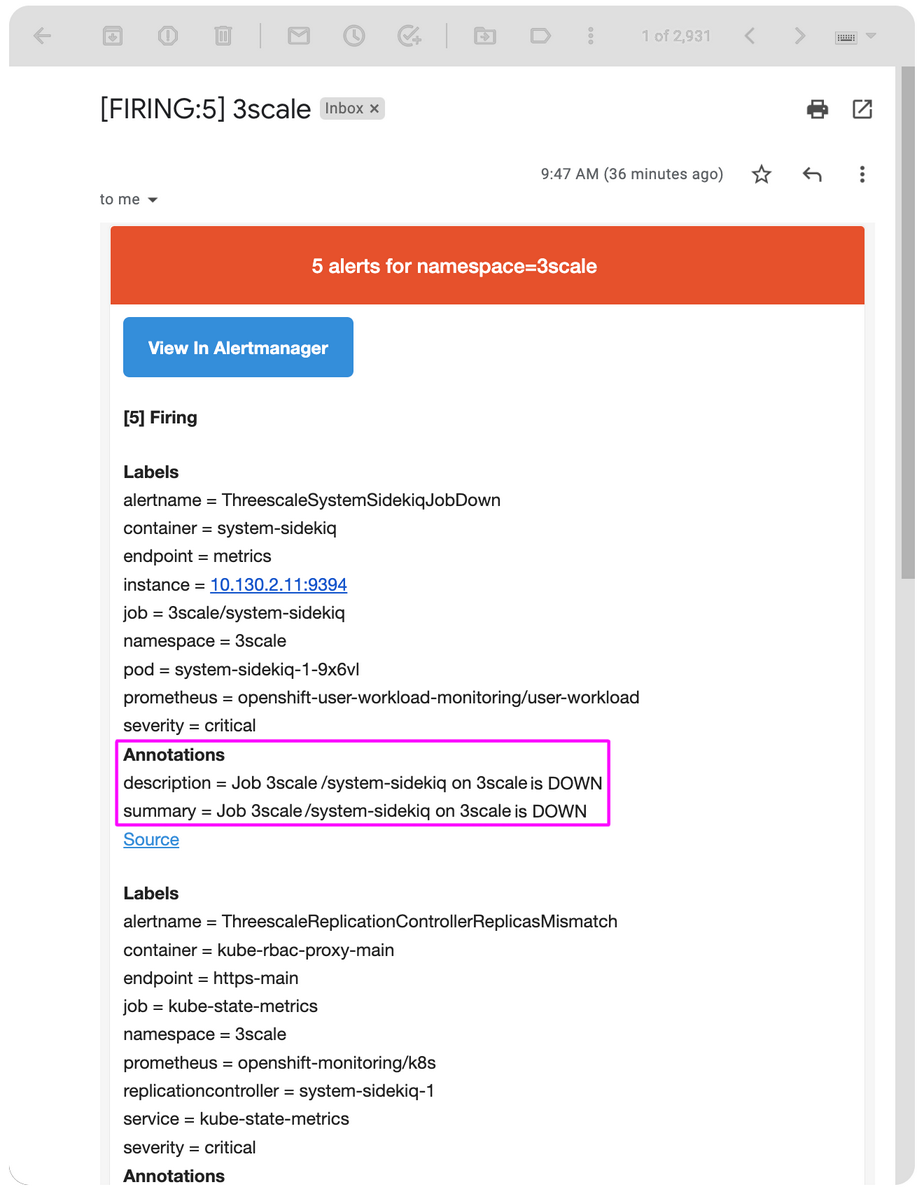
and finally, the destination mailbox will start to receive all fired alerts:
Creating custom 3Scale alerts
Let’s say you have to create a custom alert for 3Scale. Better than that: I’ve come up with additional 3scale alerts that will complement the existing ones, so we can get additional coverage, mainly with APICast instances that are not the default ones.
So, lets’s trying adding those alerts to the existing stack:
oc delete PrometheusRule threescale-custom-alerts -n $MANAGER_NS ; cat > threescale-custom-alerts.yaml <<EOL
apiVersion: monitoring.coreos.com/v1
kind: PrometheusRule
metadata:
labels:
app: 3scale-api-management
prometheus: application-monitoring
role: alert-rules
name: threescale-custom-alerts
namespace: $MANAGER_NS
spec:
groups:
- name: 3scale/custom.rules
rules:
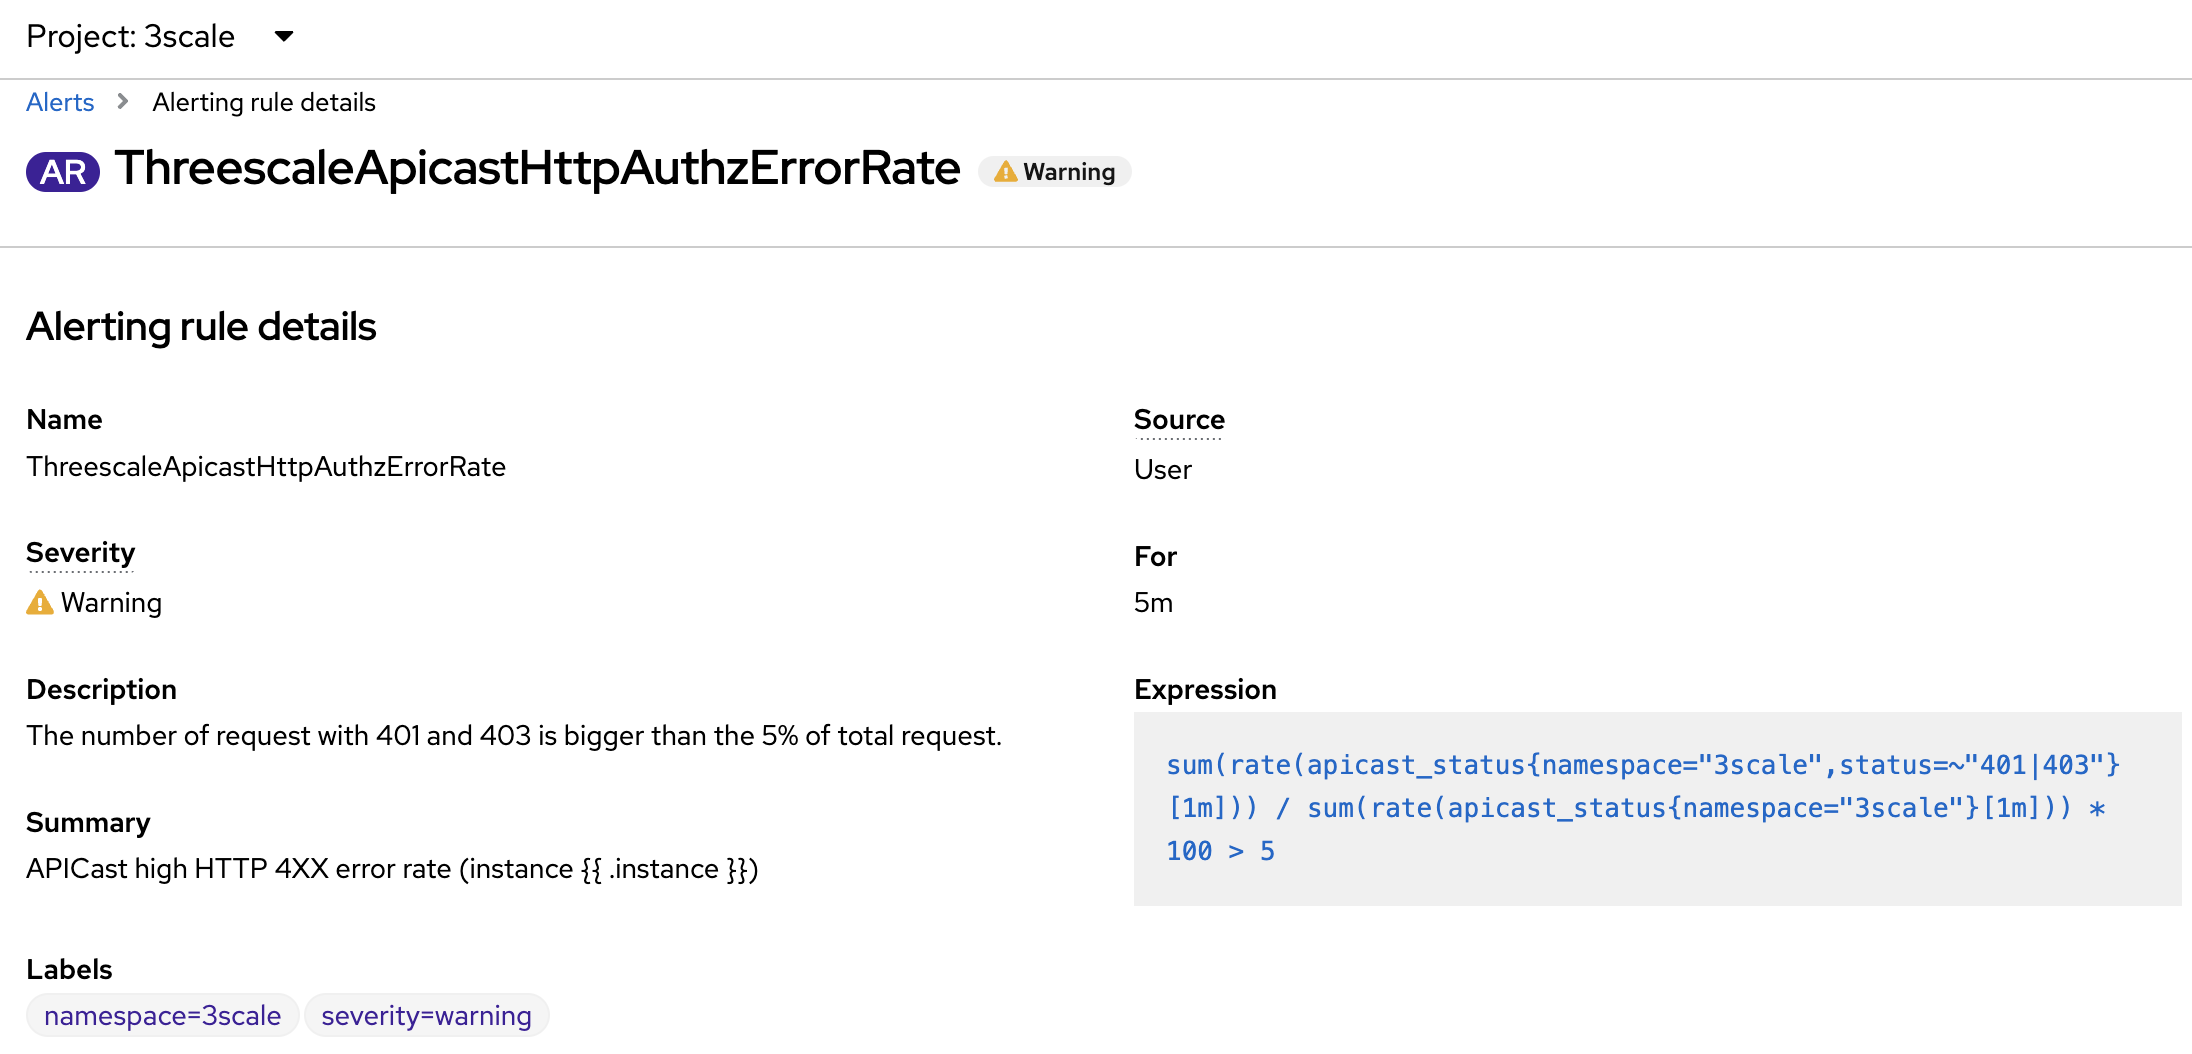
- alert: ThreescaleApicastHttpAuthzErrorRate
annotations:
description: The number of request with 401 and 403 is bigger than the 5% of total
request.
summary: APICast high HTTP 4XX error rate (instance {{ $labels.instance }})
expr: sum(rate(apicast_status{namespace='$MANAGER_NS', status=~"401|403"}[1m])) / sum(rate(apicast_status{namespace='$MANAGER_NS'}[1m])) * 100 > 5
for: 5m
labels:
severity: warning
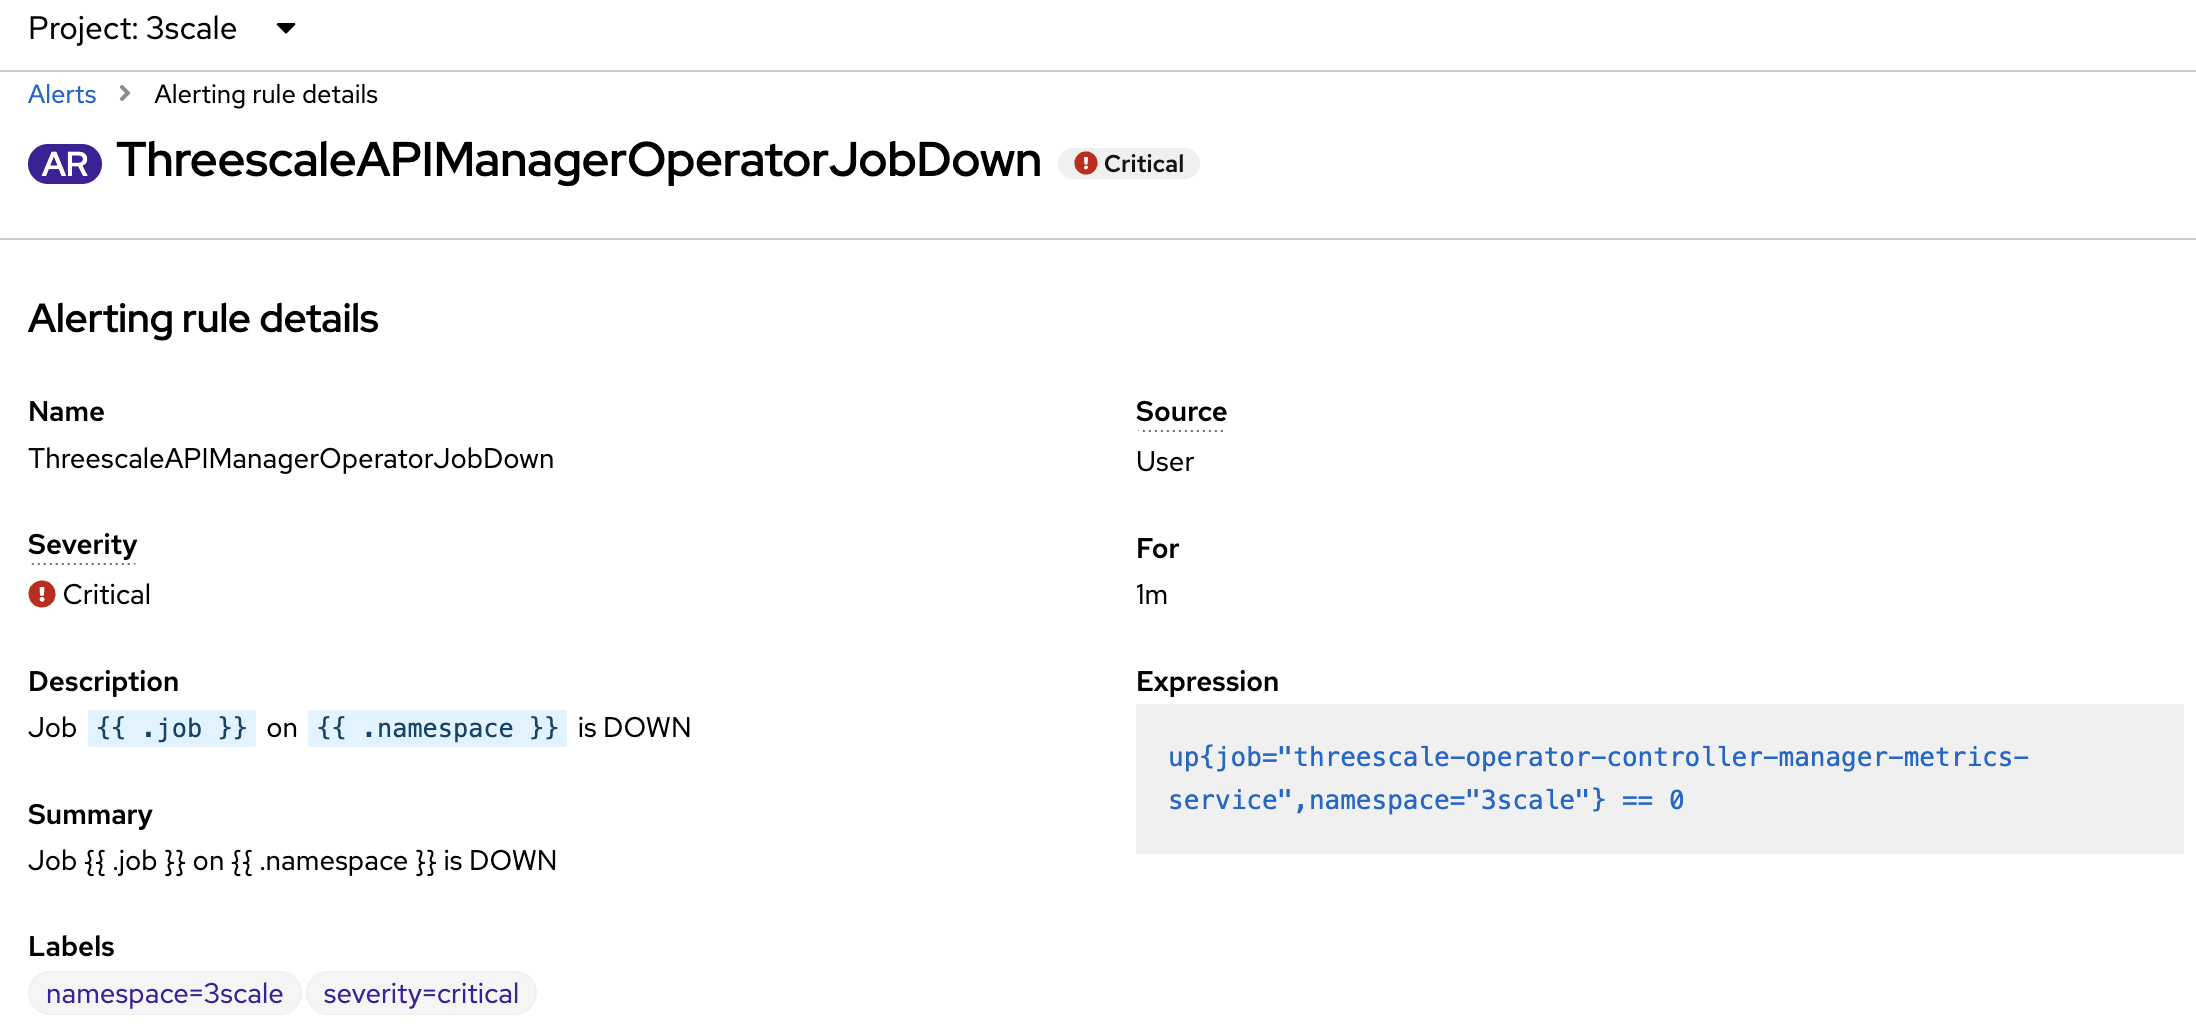
- alert: ThreescaleAPIManagerOperatorJobDown
annotations:
description: Job {{ $labels.job }} on {{ $labels.namespace }} is DOWN
summary: Job {{ $labels.job }} on {{ $labels.namespace }} is DOWN
expr: up{job="threescale-operator-controller-manager-metrics-service",namespace="$MANAGER_NS"} == 0
for: 1m
labels:
severity: critical
- alert: ThreescaleBackendListener5XXRequestsHigh(2500)
annotations:
description: Job {{ $labels.job }} on {{ $labels.namespace }} has more than
5000 HTTP 5xx requests in the last 5 minutes
summary: Job {{ $labels.job }} on {{ $labels.namespace }} has more than 2500
HTTP 5xx requests in the last 5 minutes
expr: sum(rate(apisonator_listener_response_codes{job=~"backend.*",namespace="$MANAGER_NS",resp_code="5xx"}[5m]))
by (namespace,job,resp_code) > 2500
for: 5m
labels:
severity: warning
- alert: ThreescaleApicastIntranetJobDown
annotations:
description: Job {{ $labels.job }} on {{ $labels.namespace }} is DOWN
summary: Job {{ $labels.job }} on {{ $labels.namespace }} is DOWN
expr: up{job=~".*/apicast-production|.*/apicast-staging",namespace="3scale-apicast-intranet"}
== 0
for: 1m
labels:
severity: critical
- alert: ThreescaleApicastInternetJobDown
annotations:
description: Job {{ $labels.job }} on {{ $labels.namespace }} is DOWN
summary: Job {{ $labels.job }} on {{ $labels.namespace }} is DOWN
expr: up{job=~".*/apicast-production|.*/apicast-staging",namespace="3scale-apicast-internet"}
== 0
for: 1m
labels:
severity: critical
- alert: ThreescaleApicastMobileJobDown
annotations:
description: Job {{ $labels.job }} on {{ $labels.namespace }} is DOWN
summary: Job {{ $labels.job }} on {{ $labels.namespace }} is DOWN
expr: up{job=~".*/apicast-production|.*/apicast-staging",namespace="3scale-apicast-mobile"}
== 0
for: 1m
labels:
severity: critical
EOL
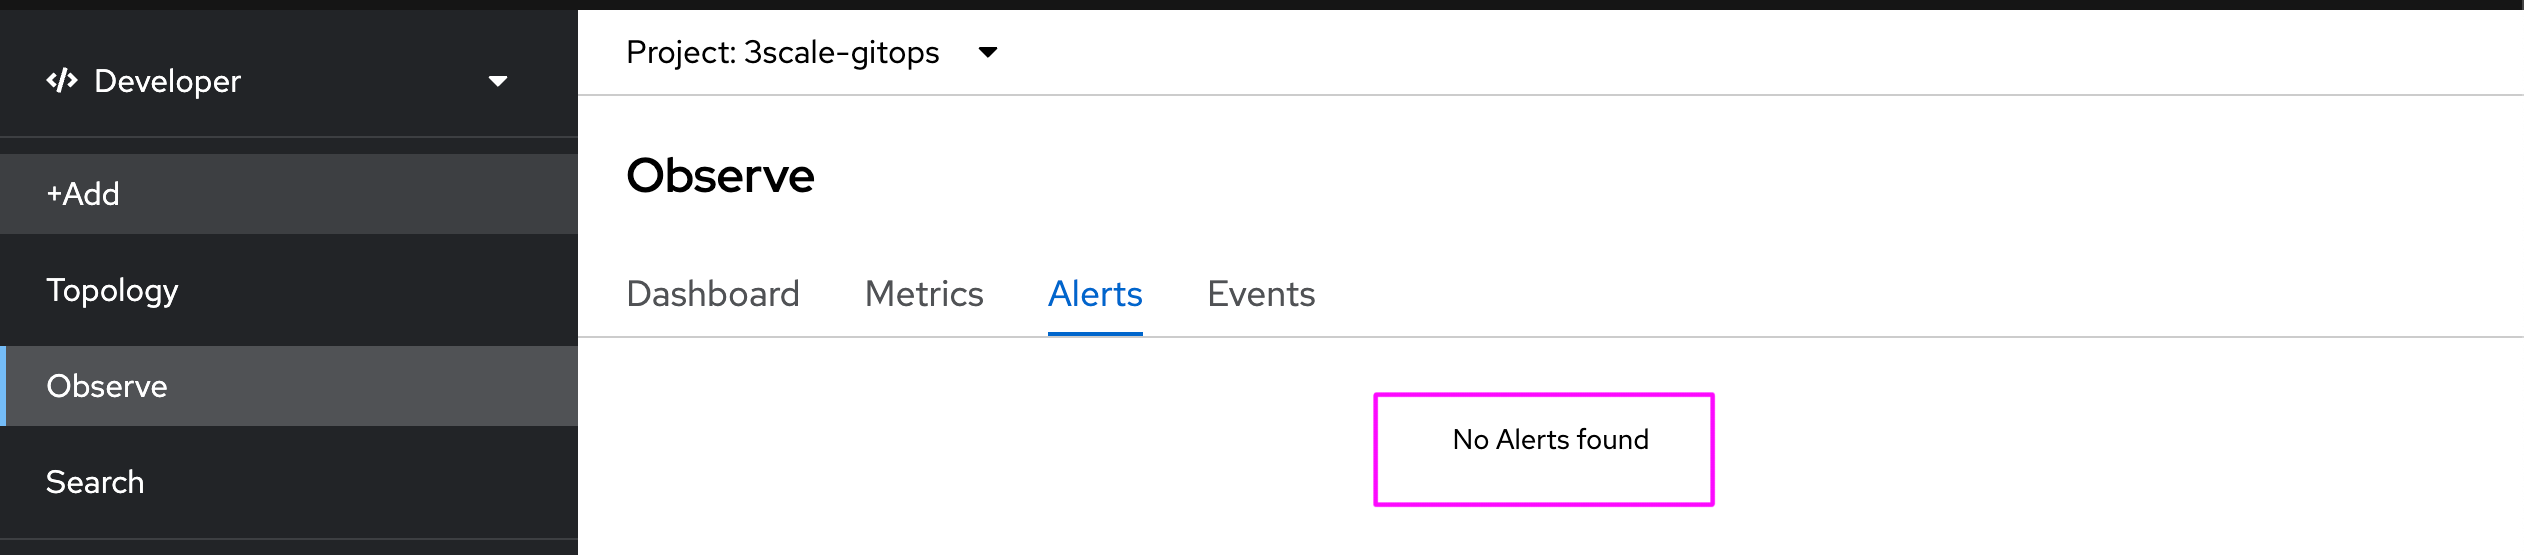
oc create -f threescale-custom-alerts.yaml -n $MANAGER_NSYou should see all created alerts in the Observe view at Alerts menu item:
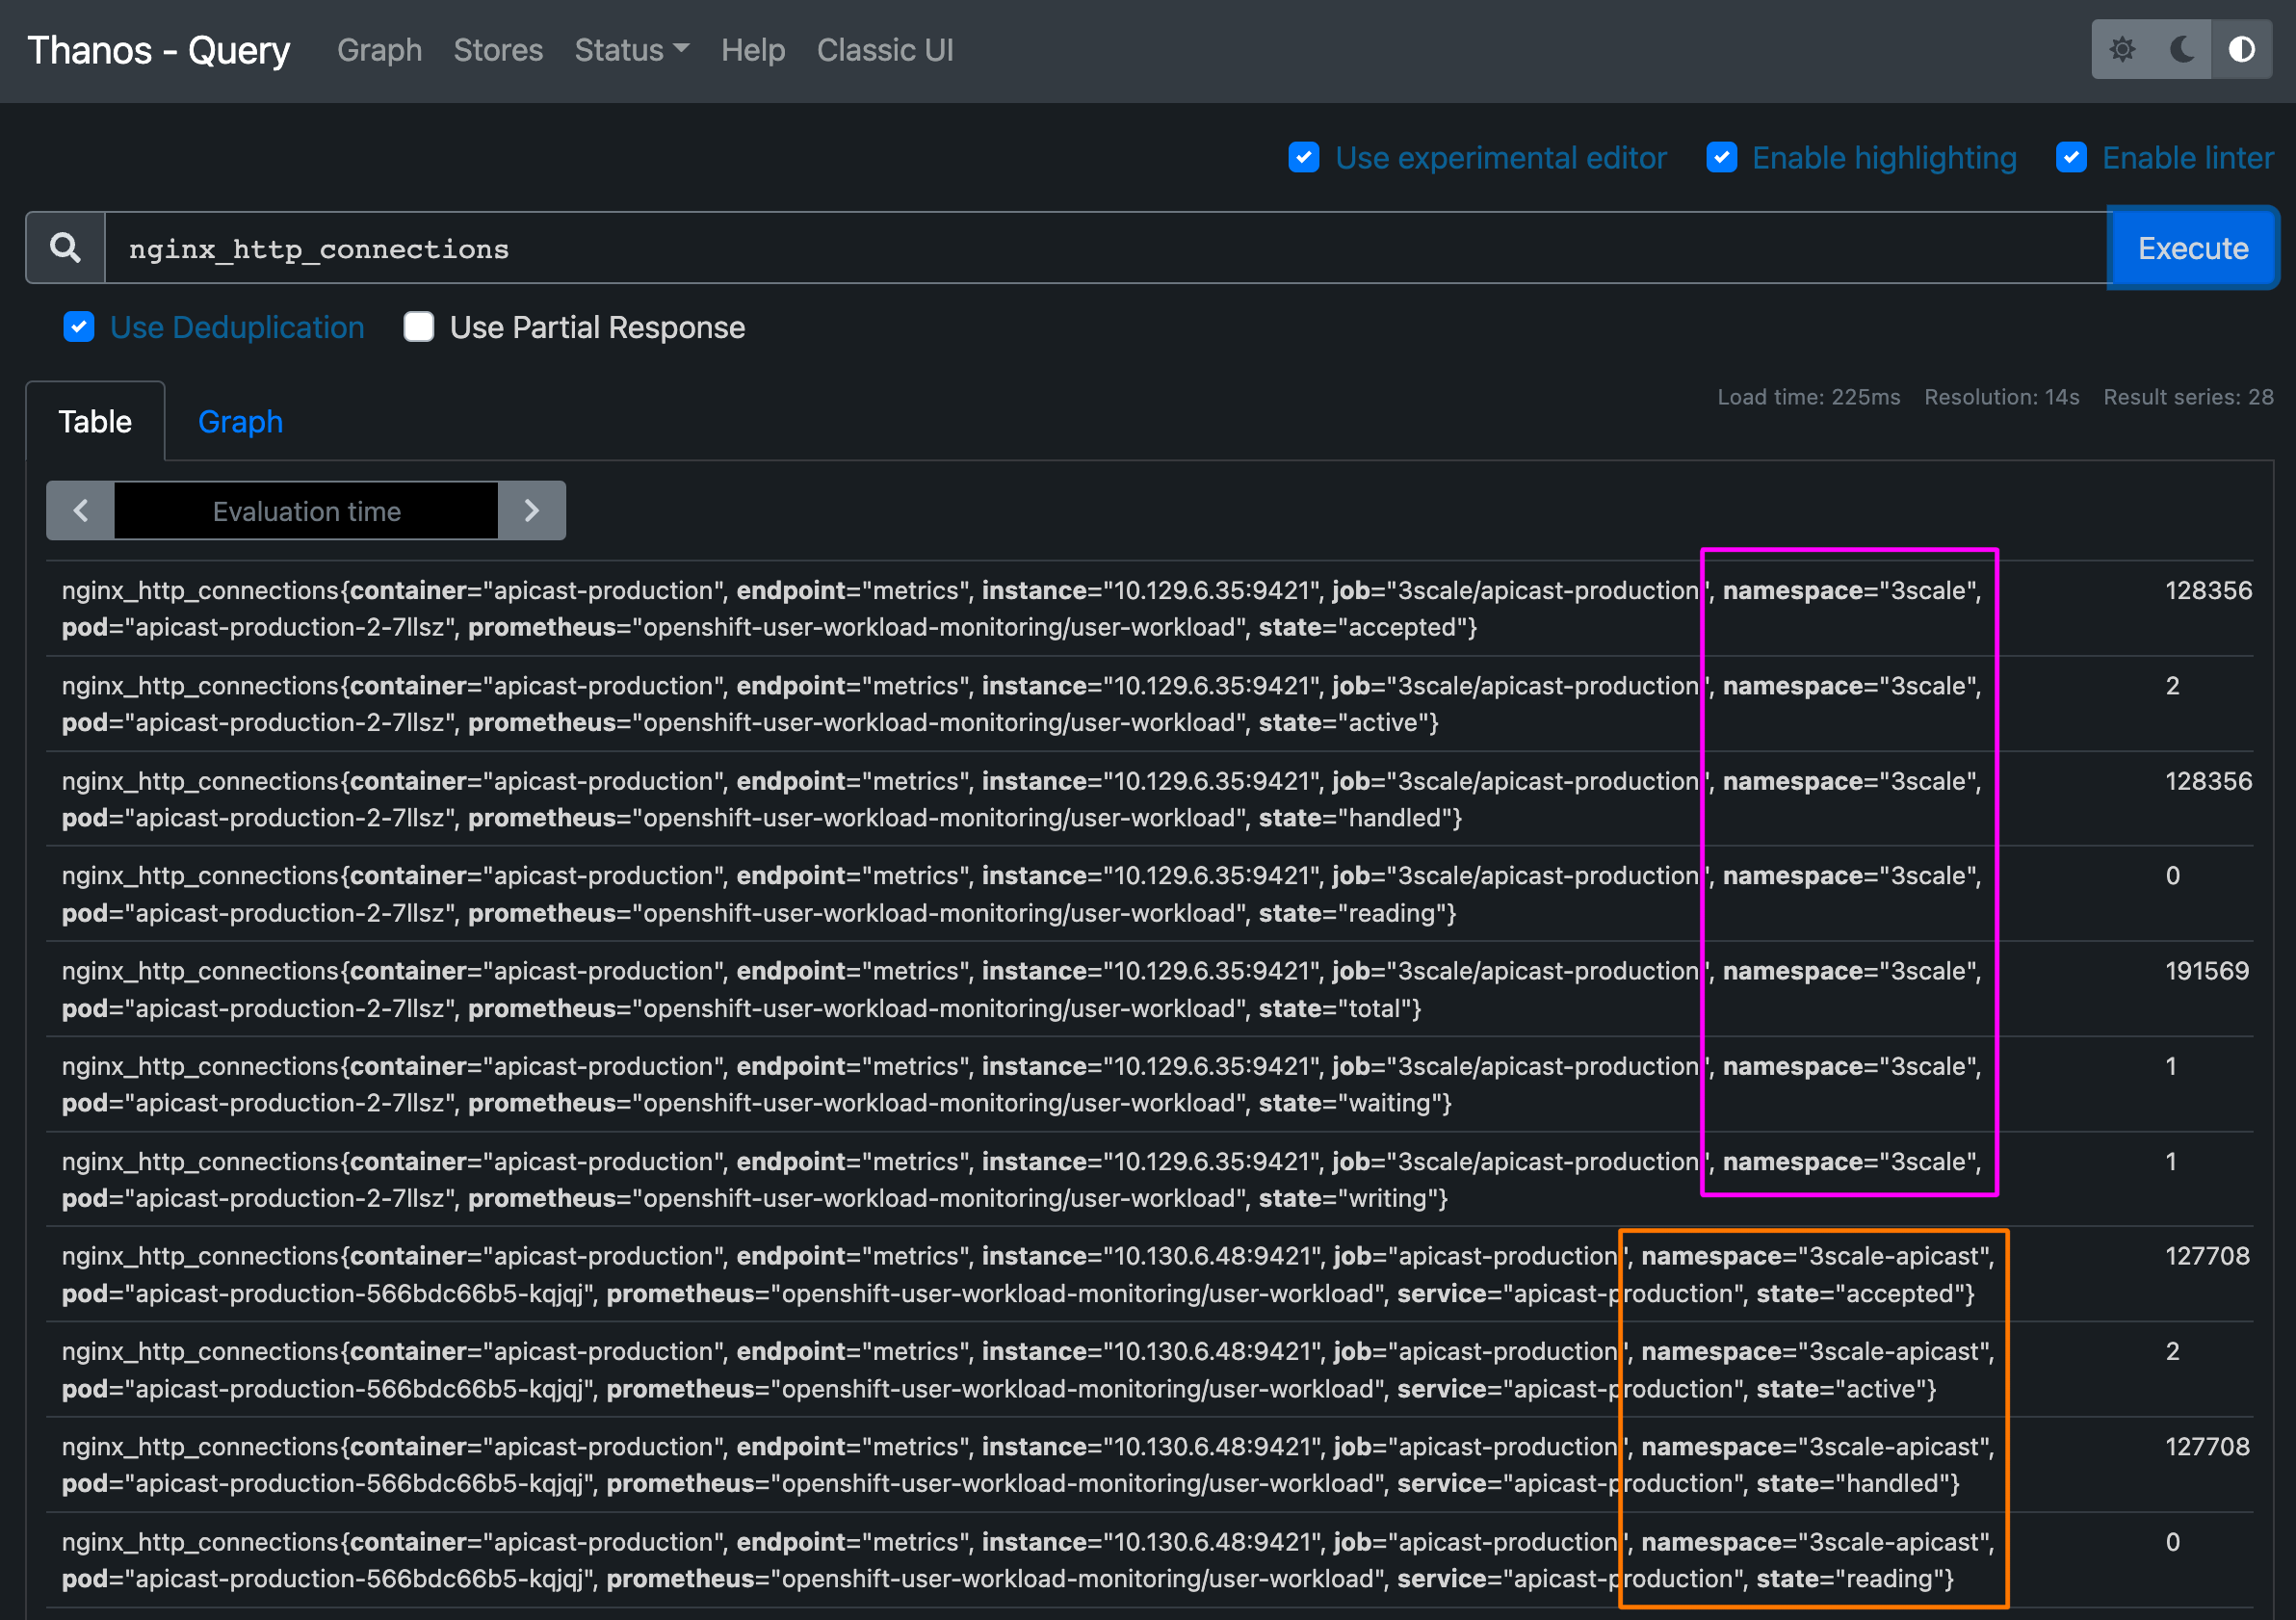
Testing with thanos-querier
If you want to work on PromSQL expressions, just try using thanos querier:
oc get route -n openshift-console -lapp=console | awk 'NR==2 {s1=\"https://\"; s2=\"/monitoring/query-browser?query0=\"; print s1\$2s2}'Conclusion
In this article, we went through 3Scale monitoring with all OpenShift monitoring provided resources. You should now be able to see all Dashboards from Grafana, monitor resources, and receive alerts with a preconfigured SMTP account.
Make sure to check out other scenarios and, along the way, configure different types of receivers!
And most importantly, have fun monitoring, and see you in the next coffee hack!
![]()