Hello everyone!
If you want to collect and get a better understanding of JVM Thread Dumps and thread analysis in general, I’ve come up with the following script that collects all JVM processes running with the highest CPU utilization based on a pre-configured threshold.
This work was made due to problems using the https://access.redhat.com/labs/jvmpeg/ tool, as some RHEL instances might not have the correct timezone and/or other locale issues. If you can change these settings on RHEL without impacting the whole environment and applications, you can use the jvmpeg tool, ensuring that the following configurations have been made before:
export TZ="America/Toronto"
export LC_TIME=en_US.utf8
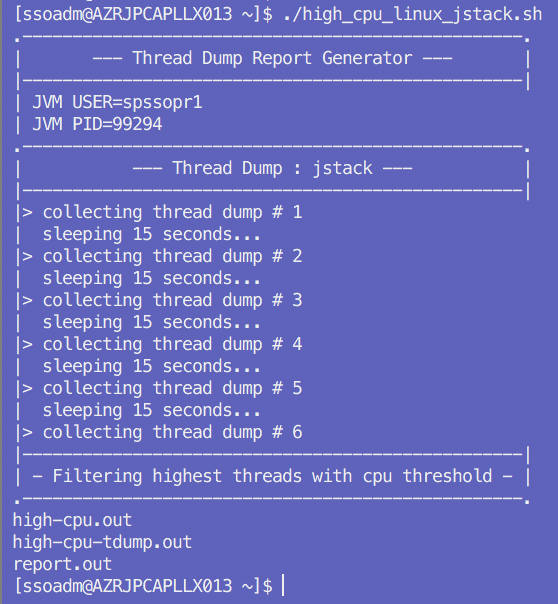
The script will output the following by collecting JVM PID and user generating 3 artifacts at the end of its execution:

- high-cpu.out (all PID with highest cpu utilization based on a threshold – 70% at default)
- high-cpu-tdump.out (all thread dumps generated by jstack in 6 series with 15 seconds of pause between each one)
- report.out (the final report that correlates all previously generated artifacts)
For every process equal or above $CPU_THRESHOLD variable, it will generate something like this:
PID 53961 <JVM_USER> 82.4% -> nid=0xd2c9
Found at line 10486 "default task-629" #4313 prio=5 os_prio=0 tid=0x000000000f601800 nid=0xd2c9 waiting on condition [0x00002b43b7953000]
java.lang.Thread.State: TIMED_WAITING
Found at line 23090 "default task-629" #4313 prio=5 os_prio=0 tid=0x000000000f601800 nid=0xd2c9 waiting on condition [0x00002b43b7953000]
java.lang.Thread.State: TIMED_WAITING
Found at line 35995 "default task-629" #4313 prio=5 os_prio=0 tid=0x000000000f601800 nid=0xd2c9 waiting on condition [0x00002b43b7953000]
java.lang.Thread.State: TIMED_WAITING
Found at line 49214 "default task-629" #4313 prio=5 os_prio=0 tid=0x000000000f601800 nid=0xd2c9 waiting on condition [0x00002b43b7952000]
java.lang.Thread.State: TIMED_WAITING
Found at line 63956 "default task-629" #4313 prio=5 os_prio=0 tid=0x000000000f601800 nid=0xd2c9 waiting on condition [0x00002b43b7953000]
java.lang.Thread.State: TIMED_WAITING
All PID with their thread list will be saved on the report.out file at the end of script execution.
All line numbers pointed in this file refers to the high-cpu-tdump.out file that all threads were collected.
Also, you might want to get a deep understanding of the collected dump using the TDA – Thread Dump Analyser tool (https://github.com/irockel/tda)
There are six different possible thread states (NEW, RUNNABLE, BLOCKED, WAITING, TIMED_WAITING, TERMINATED), but the ones of interest to us are:
RUNNABLE. That means the thread is actively doing something. These are the most interesting threads because, in the context of our long-running threads, it means it’s been doing one thing for quite a while, which is almost always unusual.
BLOCKED. The thread has something to do, but it can’t until a shared resource is freed. An example would be a thread that wants to access a table of the database, but can’t do so because another thread has locked that table. These are also interesting to us, as many blocked threads indicate a bottleneck in the application.
WAITING and TIMED_WAITING. These threads have been explicitly told (in the code) to do nothing. The difference between WAITING and TIMED_WAITING is that TIMED_WAITING includes a timeout, while a WAITING thread will wait indefinitely. Waiting threads are usually less helpful to us for identifying performance problems, as it’s often reasonable for threads to be in this state for long periods. If these are the only interesting threads, I’d recommend extending the interval between thread dumps.
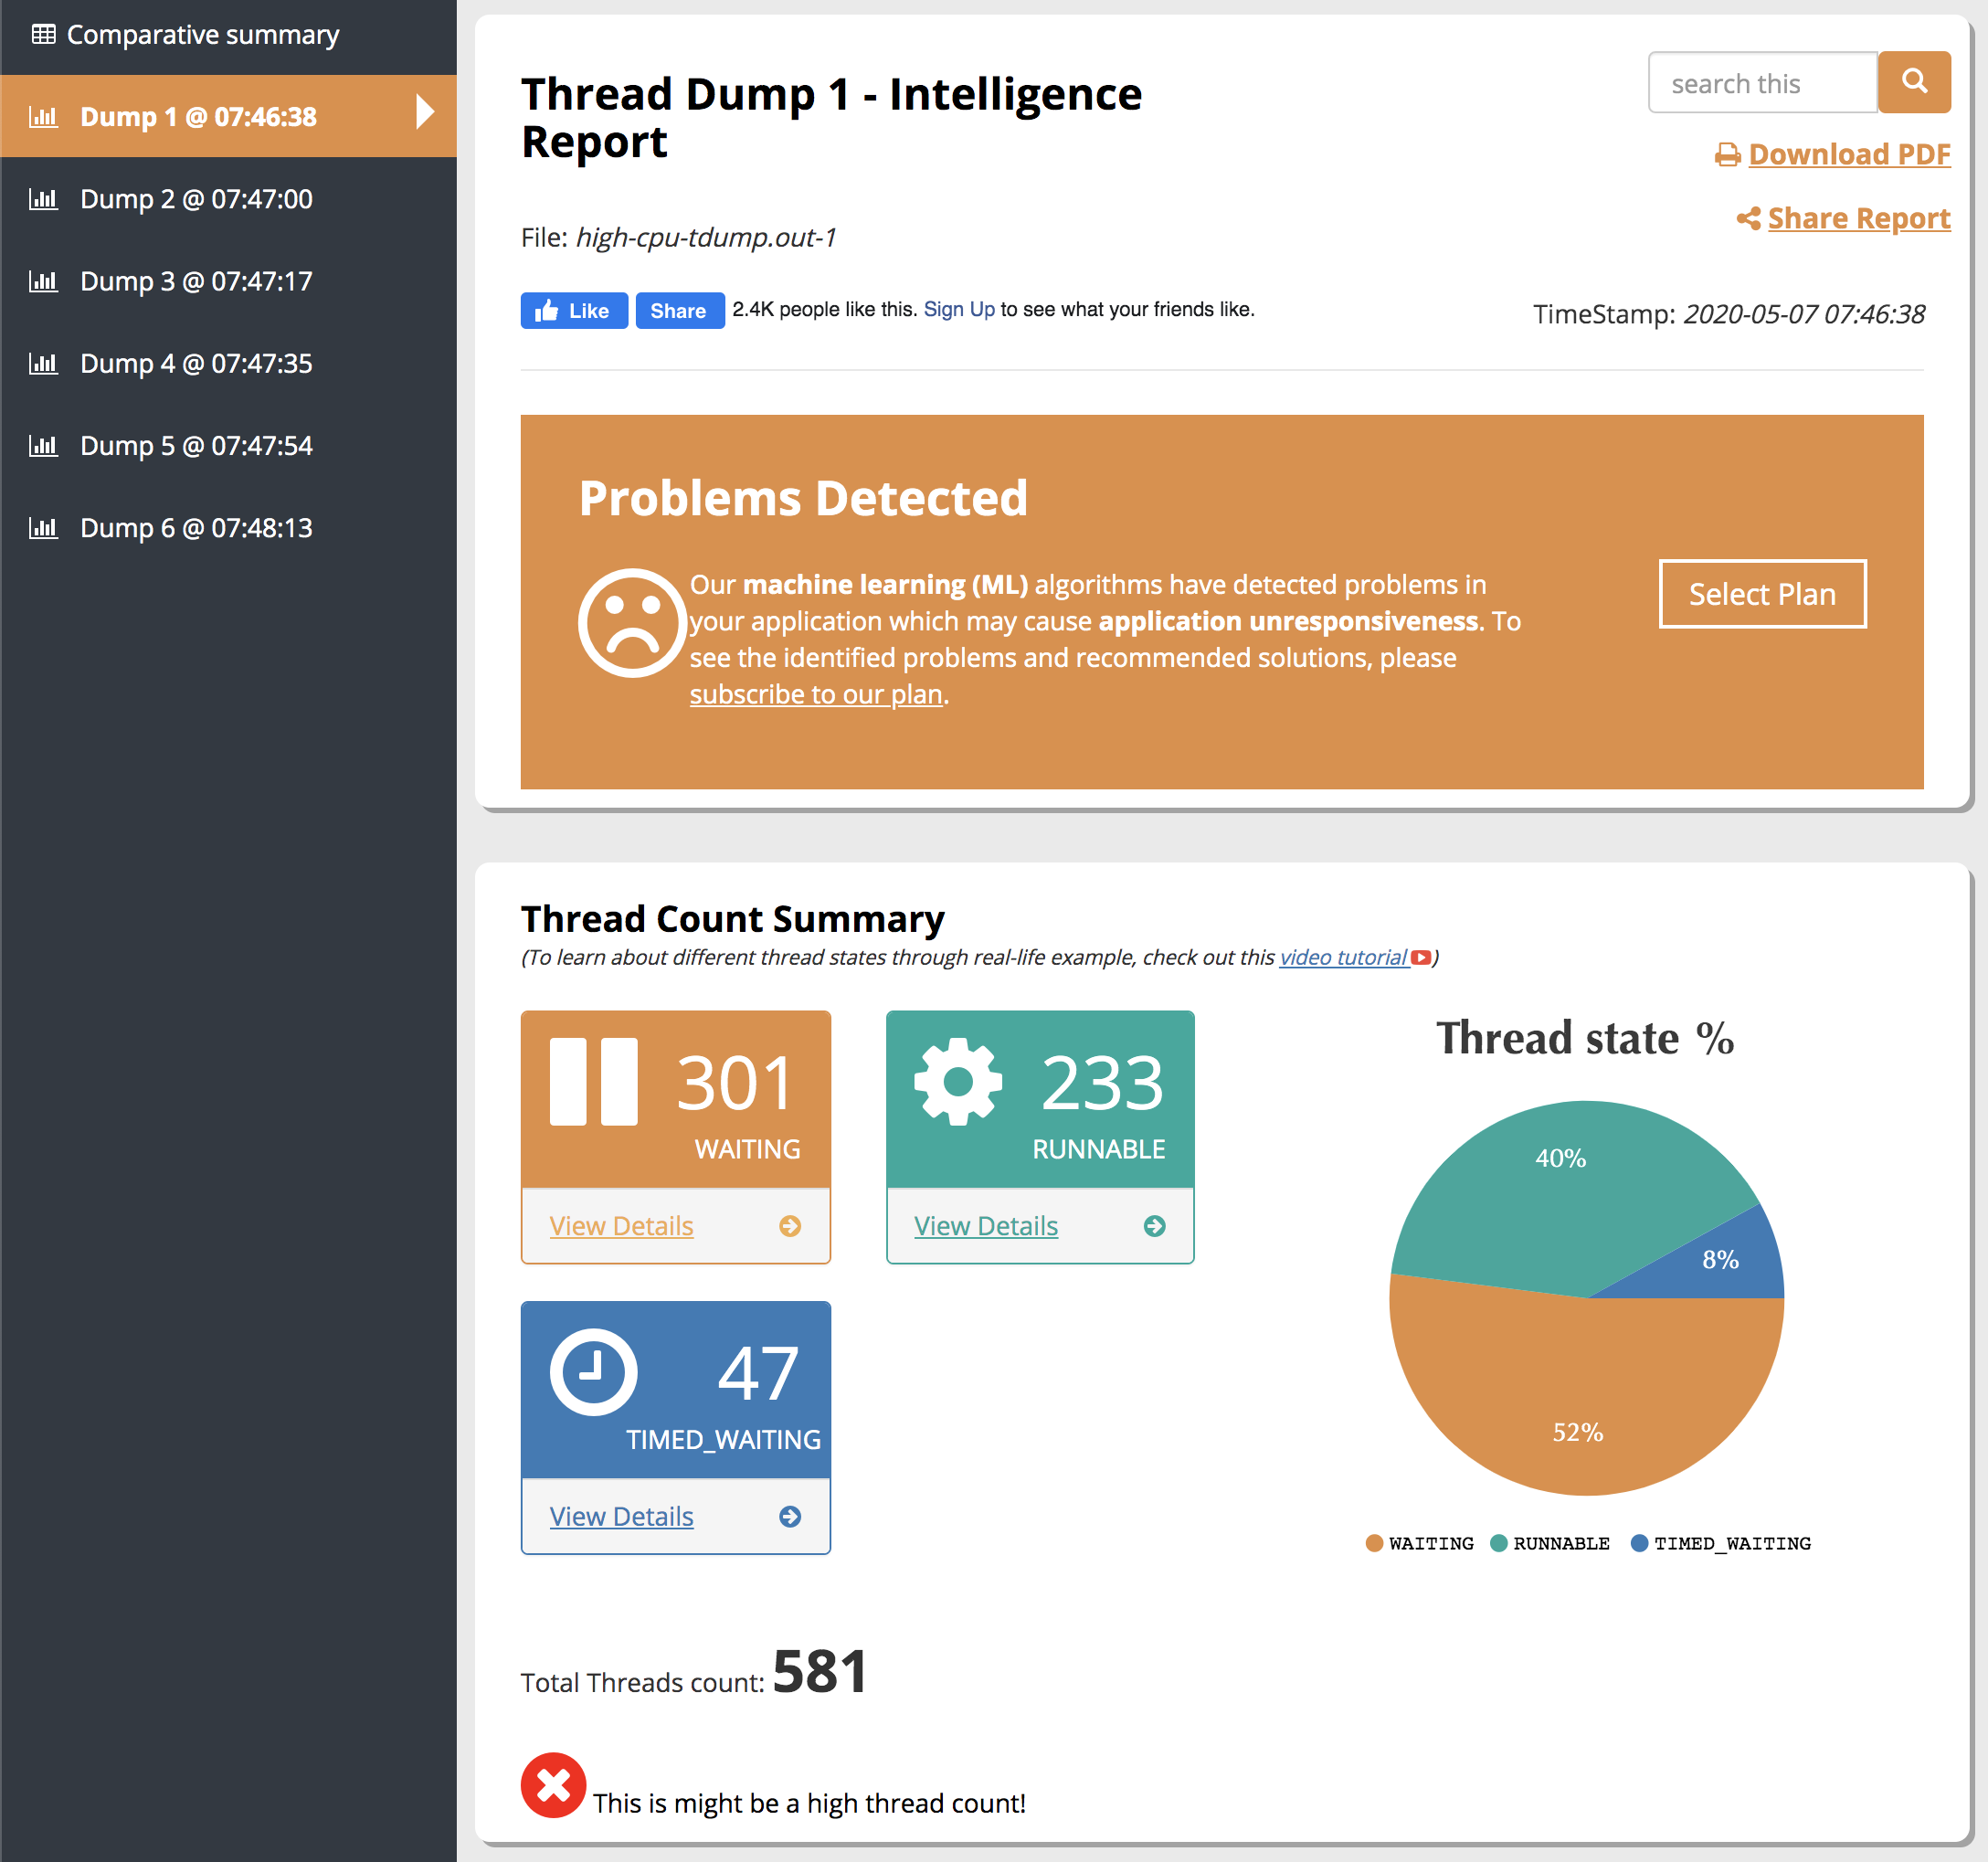
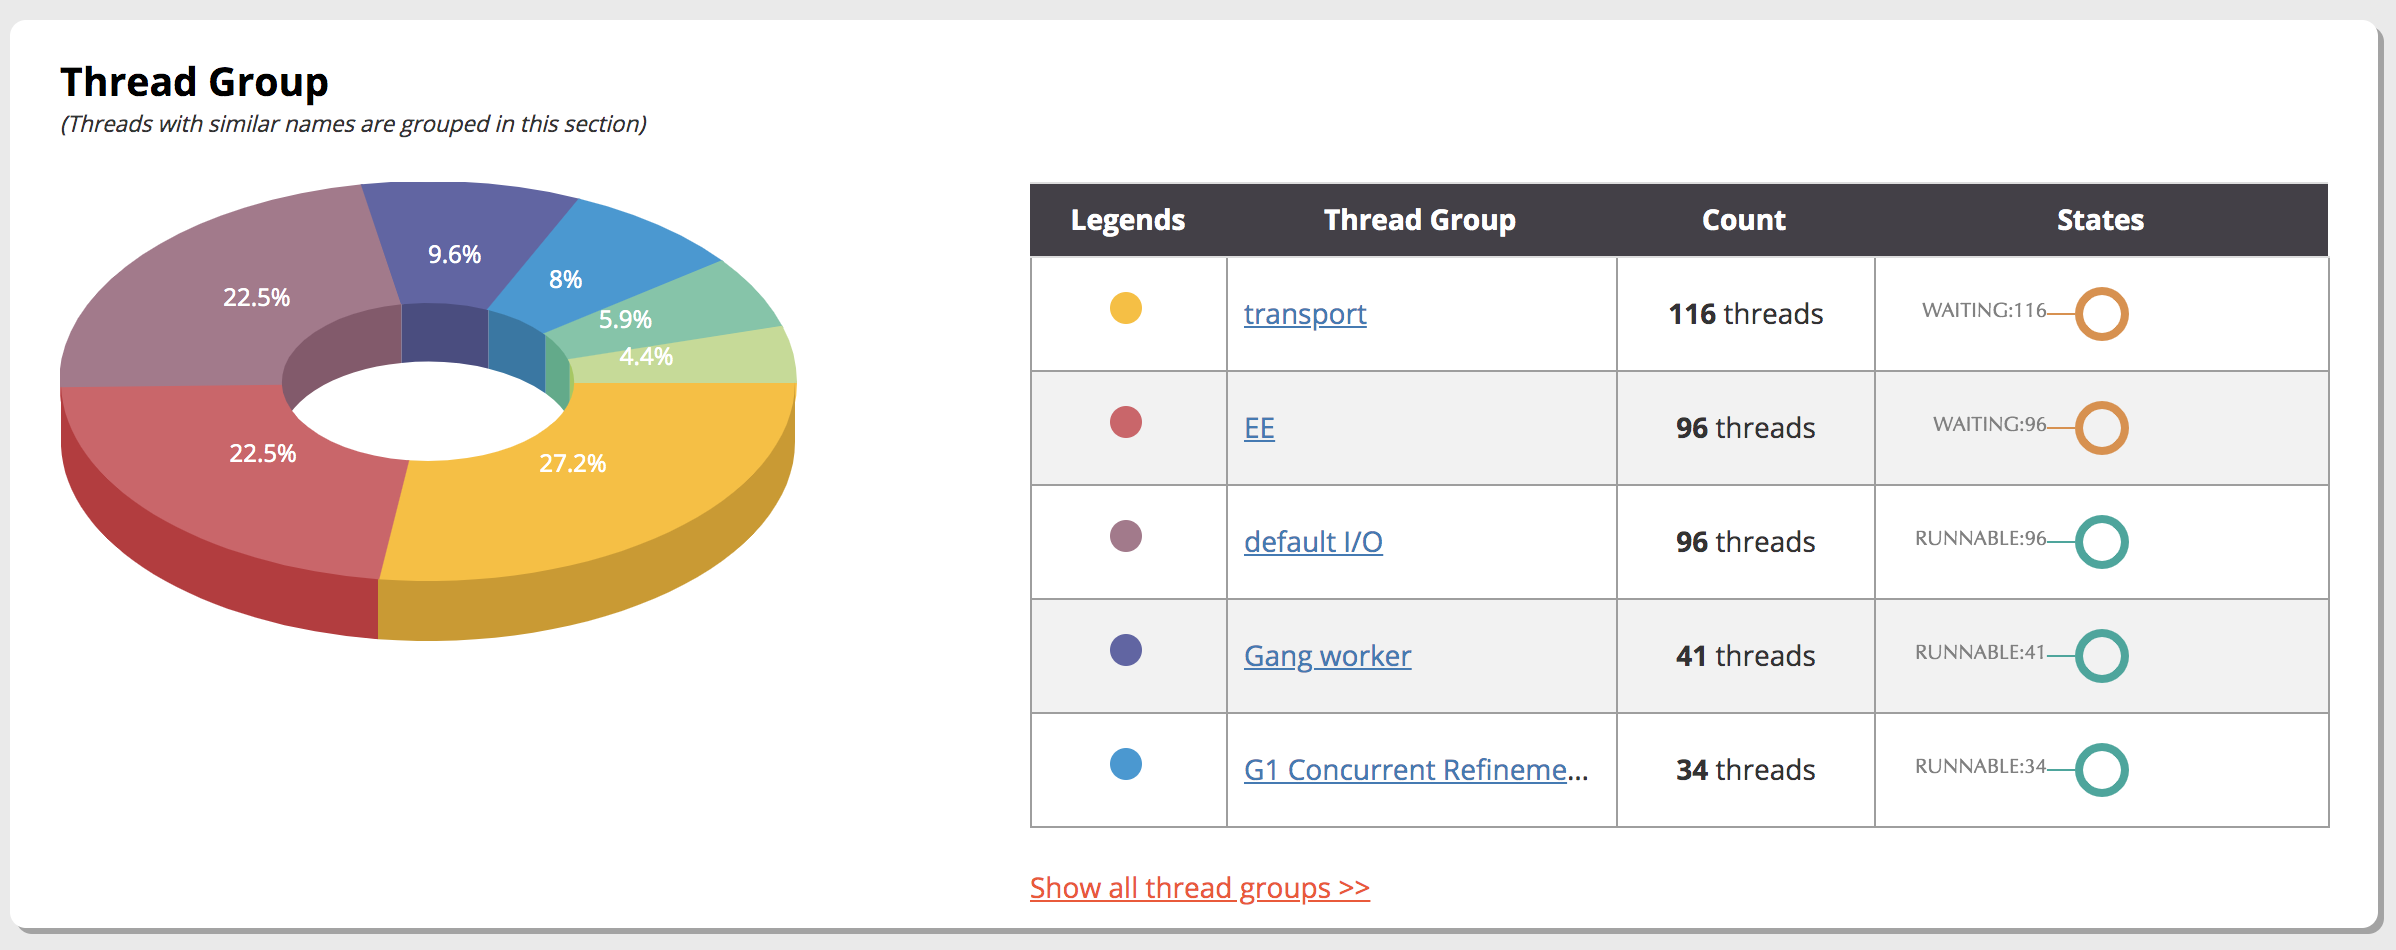
There’s an online tool at https://jstack.review that give us some graphics and a detailed overview of all collected data from our tdump artifact:
You can also use the https://fastthread.io application to give you more details and the option to export the report to a PDF file:


The final script can be used at any JVM process with the assistance of jstack tool:
#!/bin/sh
#
# Captures cpu by light weight thread and thread dumps a specified number of
# times and INTERVAL. Thread dumps are retrieved using jstack and are placed in
# high-cpu-tdump.out
#
# usage: sh ./high_cpu_linux_jstack.sh
#
# original source: https://access.redhat.com/solutions/46596
# author: rabreu@redhat.com
#
CURRENT_DATE_TIME=$(date +%d%m_%H%M)
JVM_HOST=$(hostname)
JVM_USER=$(ps -ef | grep java | grep server | awk 'NR==1{print $1}')
# Process PID
JVM_PID=$(ps -ef | grep $JVM_USER | grep java | awk 'NR==1{print $2}')
# Number of times to collect data.
LOOP=6
# Interval in seconds between data points.
INTERVAL=15
# Minimum CPU threshold to look for at JVM PID's
CPU_THRESHOLD=70
#
echo ".--------------------------------------------------."
echo "| --- Thread Dump Report Generator --- |"
echo "|--------------------------------------------------|"
echo "| JVM USER="$JVM_USER" "
echo "| JVM PID="$JVM_PID" "
echo ".--------------------------------------------------."
#
nid_occurrences() {
printf -v hex '%x' "$1"
hex="nid=0x${hex}"
awk -v record="$hex" '{line=$0; type=$2; nid=$7; if(nid==record){print "Found at line "NR, line; getline; print $1,$2}}' ./high-cpu-tdump.out
echo " "
}
export -f nid_occurrences
#
rm -fr high-cpu.out high-cpu-tdump.out report.out
echo "| --- Thread Dump : jstack --- |"
echo "|--------------------------------------------------|"
#
for ((i=1; i <= $LOOP; i++))
do
_now=$(date)
echo "${_now}" >>high-cpu.out
top -b -n 1 -H -p $JVM_PID >>high-cpu.out
echo "${_now}" >>high-cpu-tdump.out
sudo -u $JVM_USER jstack -l $JVM_PID >>high-cpu-tdump.out
echo "|> collecting thread dump #" $i
if [ $i -lt $LOOP ]; then
echo "| sleeping "$INTERVAL" seconds..."
sleep $INTERVAL
fi
done
#
echo "|--------------------------------------------------|"
echo "| - Filtering highest threads with cpu threshold - |"
echo ".--------------------------------------------------."
#
sed -i '/ 0.0 /d' high-cpu.out
awk -v threshold="$CPU_THRESHOLD" -v user="$JVM_USER" '$2 == user && $9 >= threshold {printf "%s%s%s%s%s%s%s%x\n","PID ",$1," ",$2," ",$9,"% -> nid=0x",$1;system("bash -c '\''nid_occurrences "$1"'\''")}' ./high-cpu.out > report.out
tar -cvf threaddump_$JVM_HOST'_'$CURRENT_DATE_TIME.tar.gz high-cpu.out high-cpu-tdump.out report.out
rm -fr high-cpu.out high-cpu-tdump.out report.out
REFERENCES:
https://access.redhat.com/solutions/46596
https://access.redhat.com/support/cases/#/case/02641821
https://access.redhat.com/labsinfo/jvmpeg#comment-1802621
https://dzone.com/articles/how-analyze-java-thread-dumps
https://confluence.atlassian.com/confkb/how-to-analyze-thread-dumps-788039144.html
https://stackoverflow.com/questions/7599608/how-to-analyze-a-java-thread-dump
https://access.redhat.com/solutions/24830
![]()